 Buy $GGs
Ethereum Price Analysis: Is $ETH Bull Run at Risk? $1730 Support Holds the Key


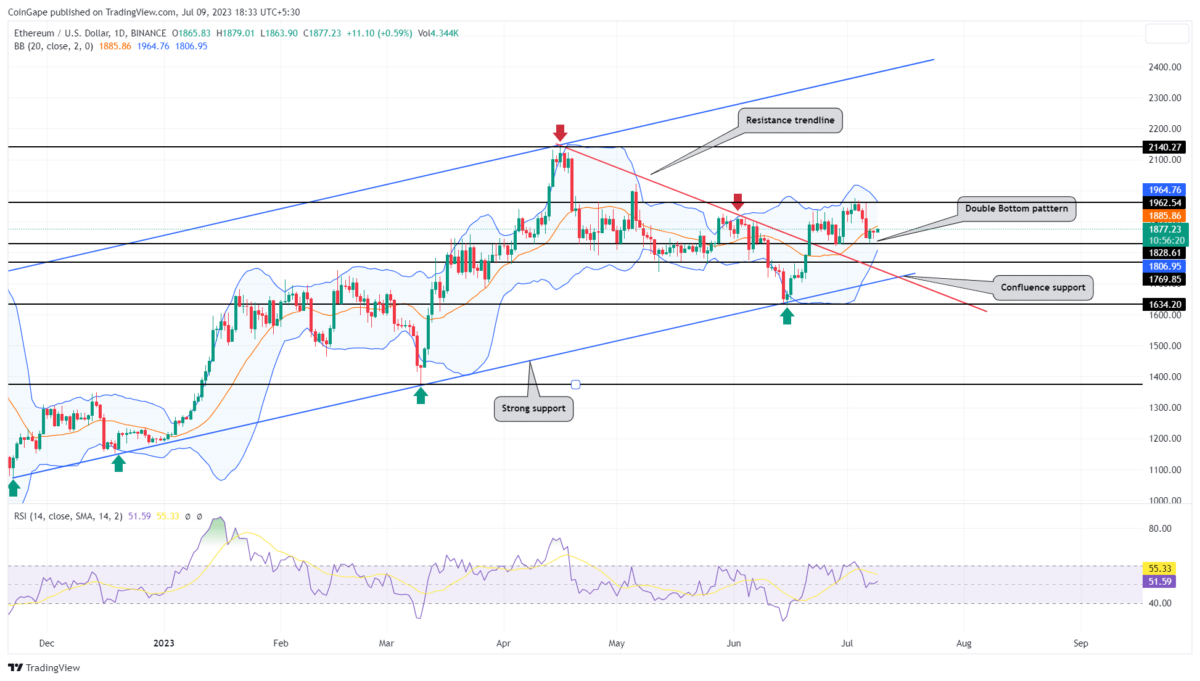
Ethereum Price Analysis: The falling Ethereum price witnessed demand pressure at a local support of $1830-$1800. Considering long tail candles near $1800, if the altcoin manages to reclaim the bullish momentum, the buyers could break above the previous swing high of $1962. This breakout will catalyze further recovery in the second-most cryptocurrencies and increase the chances of ETH surpassing the $2000 psychological mark.
Also Read: Crypto Whales Bet On Ethereum, Bitcoin, And VC Spectra
Ethereum Price Daily Chart
- The Ethereum price projected a bullish double pattern at $1820-1800 support.
- The rising lower band of the Bollinger band indicator could offer additional supply pressure.
- The intraday trading volume in Ether is $14.6 Billion, indicating a 16.9% loss.
 Source- Tradingview
Sustaining above the 1820-1800 local support, the ETH prices display a secondary reversal with lower price rejection candles. This buying pressure reflects the price trend sustaining the recent resistance trendline breakout.
By the press time, the ETH price trades at $1879 and projects a potential double-bottom reversal. With sustained buying, the price trend is expected to return to the resistance trendline projecting a 4.5% gain and reclaiming the $1960 mark.
On a larger scale, the price trend maintains a sustained recovery within a rising channel pattern. In theory, a bullish upswing in the channel leads a rally back to the overhead trendline near $2500.
Will ETH Price Lose $1730?
The ETH price upswing fails to create a significant higher high that displays a weakness in the underlying bullishness. Considering a pessimistic outlook, if the Ethereum price continues to face overhead supply near the $1960 mark. The sellers may lead a downfall to $1730 and retest the combined support of two trendline confluence. If the price sustains this support, the overall would remain bullish.
- Bollinger Band: The Bollinger Band shrinking narrow reflects a volatile sentiment in the market
- Relative Strength Index: The daily RSI slope at 50% indicates no initiation from buyers or sellers to take trend control.
Play 10,000+ Casino Games at BC Game with Ease
- Instant Deposits And Withdrawals
- Crypto Casino And Sports Betting
- Exclusive Bonuses And Rewards


Why Trust CoinGape
CoinGape has covered the cryptocurrency industry since 2017, aiming to provide informative insights Read more…to our readers. Our journal analysts bring years of experience in market analysis and blockchain technology to ensure factual accuracy and balanced reporting. By following our Editorial Policy, our writers verify every source, fact-check each story, rely on reputable sources, and attribute quotes and media correctly. We also follow a rigorous Review Methodology when evaluating exchanges and tools. From emerging blockchain projects and coin launches to industry events and technical developments, we cover all facets of the digital asset space with unwavering commitment to timely, relevant information.

Related Articles


- XRP News: Institutional Use Case Expands as Doppler Finance Integrates WXRP for Multi-Chain Access
- Trump Tariffs: Bitcoin Faces Fresh Headwinds as 15% Global Tariffs Begin This Week Amid Iran War
- Bitget Unveils ‘Crypto Anti-Bias Pledge’ To Support Women’s Inclusion In Crypto
- U.S.-Iran War: Crypto Market Rebounds as Iran Reportedly Reaches Out To U.S. To End Conflict
- Bitget Rolls Out Group-Based Maker Rates to Boost Liquidity Across Spot and Futures
- COIN Stock Analysis as Bitcoin Retests $72k Ahead of February NFP Data
- Robinhood Stock Price Prediction As Cathie Wood Buys $12M Dip in Bold ARK Move
- Bitcoin Price At Risk? Professor Who Predicted US-Iran War Says America Could Lose
- Gold Price Prediction March 2026: Rally, Crash, or Record Highs?
- RIOT Stock Prediction as Needham, Piper Sandler Slash Target After Earnings
- Cardano Price Outlook As Charles Hoskinson Warns Over CLARITY Act


