Ethereum Price Analysis: This Chart Pattern Fuels Long-Term Growth In $ETH Price


Ethereum Price Analysis: Amid the mid-June recovery, the Ethereum price rebounded from the support trendline of the rising channel pattern. Over the past seven months, the price has bounced back several times from this support indicating an active accumulation level for buying. Here’s how this pattern could further influence the ETH price.
Also Read: Bitcoin (BTC) Set For $35000, Ethereum (ETH) Above $2000 As US CPI Inflation Falls
Ethereum Price Daily Chart
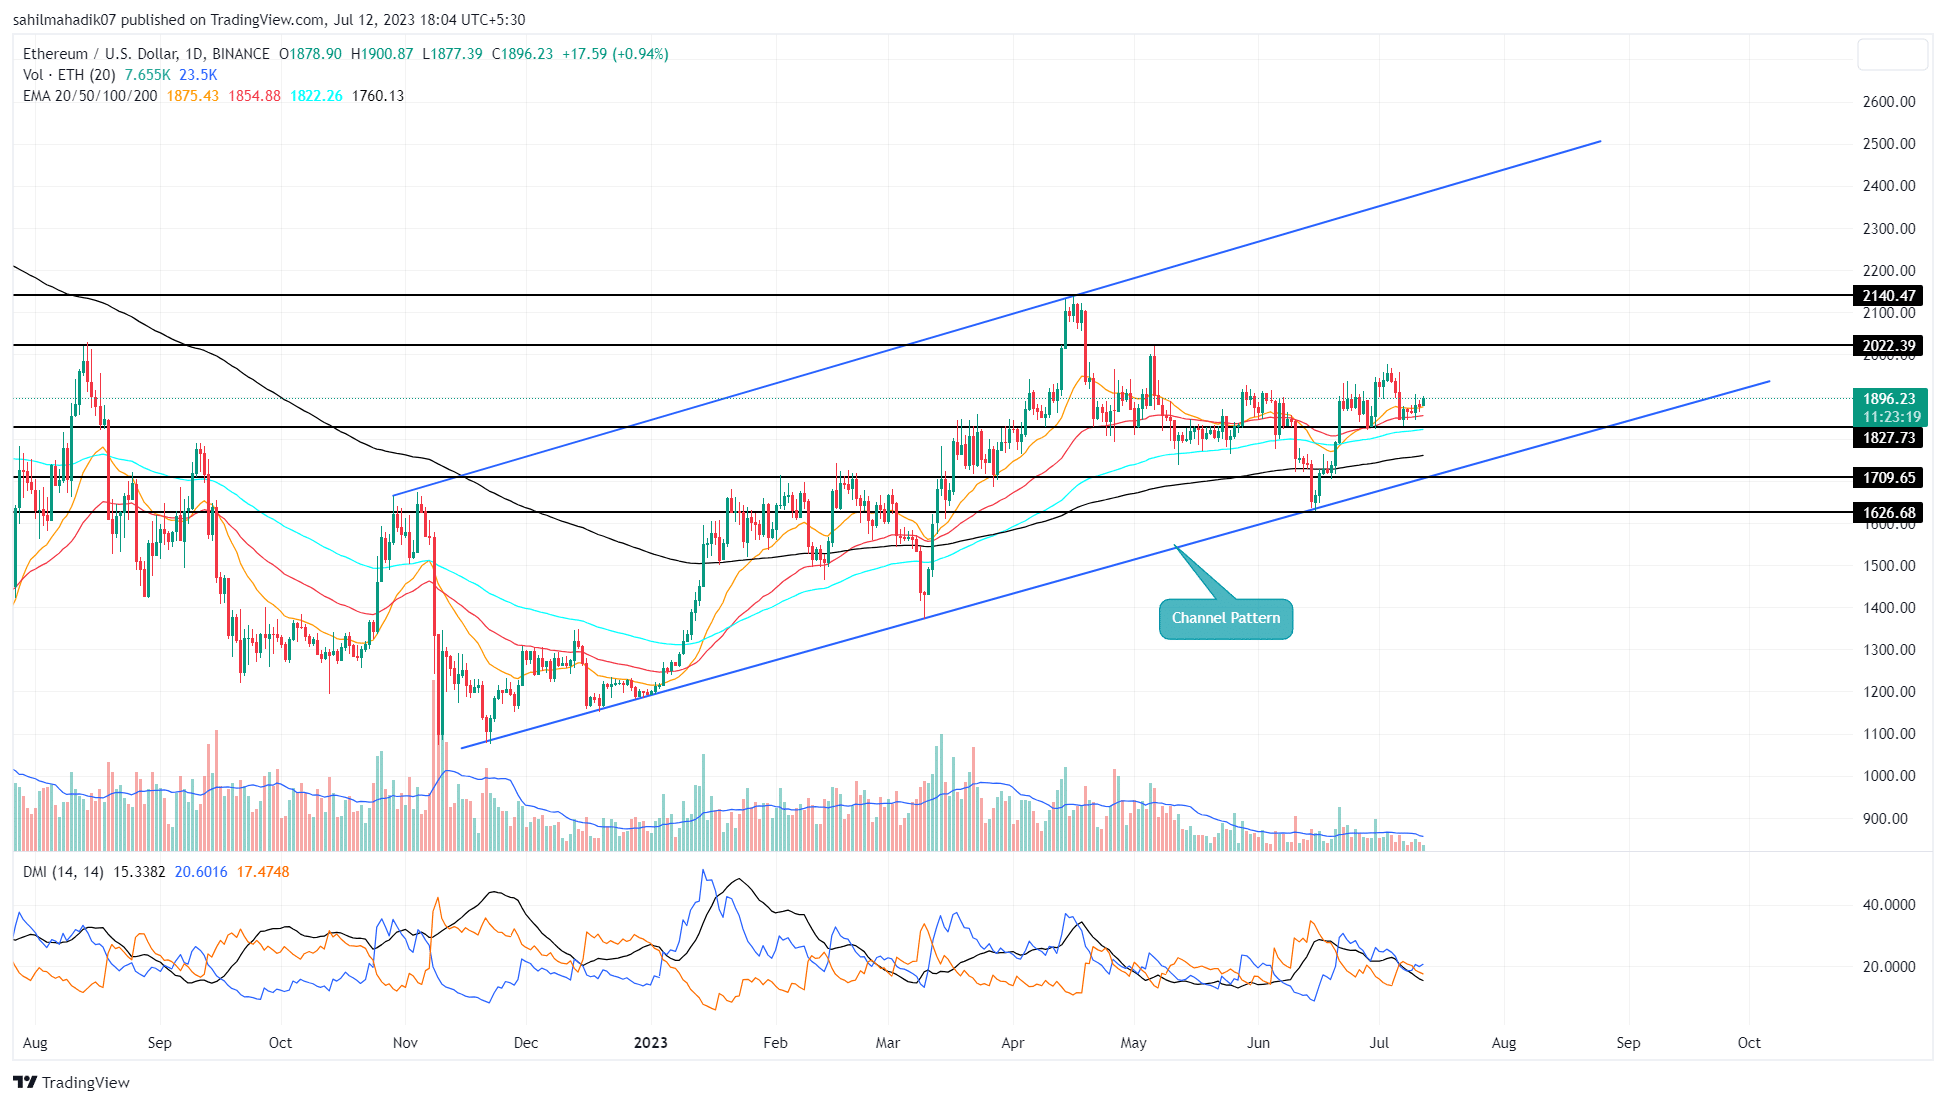
- The $1827 level stands as a strong support to maintain a bullish recovery.
- The rising channel pattern governs the current recovery rally in Ethereum
- The intraday trading volume in Ether is $4.85 Billion, indicating a 20% gain.
 Source- Tradingview
Over the past four weeks, the Ethereum price has gained 16.4% as it rebounded from the $1624 support. However, recently the recovery rally has started showing a loss of momentum and is struggling to surpass the $2000 psychological barrier.
Currently, the ETH price trades at $1890 and is trying to sustain above the $1827 support. Despite the recent correction, the buyers maintain a higher low formation indicating the Dow theory for uptrend is not invalidated.
Under the influence of channel patterns, the second largest cryptocurrency is in a recovery cycle within the chart structure. Therefore, with sustaining buying, the coin price could see gradual growth to reach the upper trendline near $2400.
[converter id=”eth-ethereum” url=”https://coingape.com/price/converter/eth-to-usd/?amount=1″]
What if Ethereum Breaks $1824?
In case, the market sentiment shows no improvement in the coming days, the breakdown below $1824 will trigger a sign of significant correction. A potential downfall could plunge the prices back to $1750 aligned with the channel pattern’s support trendline. Until this support is intact the market participants can maintain a bullish outlook.
- Exponential Moving Average: The daily EMAs(20, 50, and 100) moving below the ETH price reflect multiple support to sustained bullish rallies.
- Directional Movement Index: A bullish crossover state in DI+(blue) and DI-(orange) reflect the buyer’s attempt to rise higher

Why Trust CoinGape
CoinGape has covered the cryptocurrency industry since 2017, aiming to provide informative insights Read more…to our readers. Our journal analysts bring years of experience in market analysis and blockchain technology to ensure factual accuracy and balanced reporting. By following our Editorial Policy, our writers verify every source, fact-check each story, rely on reputable sources, and attribute quotes and media correctly. We also follow a rigorous Review Methodology when evaluating exchanges and tools. From emerging blockchain projects and coin launches to industry events and technical developments, we cover all facets of the digital asset space with unwavering commitment to timely, relevant information.

Related Articles


- US Strike on Iran Possible Within Hours: Crypto Market on High Alert
- MetaSpace Will Take Its Top Web3 Gamers to Free Dubai Trip
- XRP Seller Susquehanna Confirms Long-Term Commitment to Bitcoin ETF and GBTC
- Vitalik Buterin Offloads $3.67M in ETH Amid Ethereum Price Decline
- Crypto Market Crash: Here’s Why Bitcoin, ETH, XRP, SOL, ADA Are Falling Sharply
- COIN Stock Price Prediction: Will Coinbase Crash or Rally in Feb 2026?
- Shiba Inu Price Feb 2026: Will SHIB Rise Soon?
- Pi Network Price Prediction: How High Can Pi Coin Go?
- Dogecoin Price Prediction Feb 2026: Will DOGE Break $0.20 This month?
- XRP Price Prediction As SBI Introduces Tokenized Bonds With Crypto Rewards
- Ethereum Price Rises After SCOTUS Ruling: Here’s Why a Drop to $1,500 is Possible


