Here’s Why ApeCoin Price May Drop Below The $4.26 Support


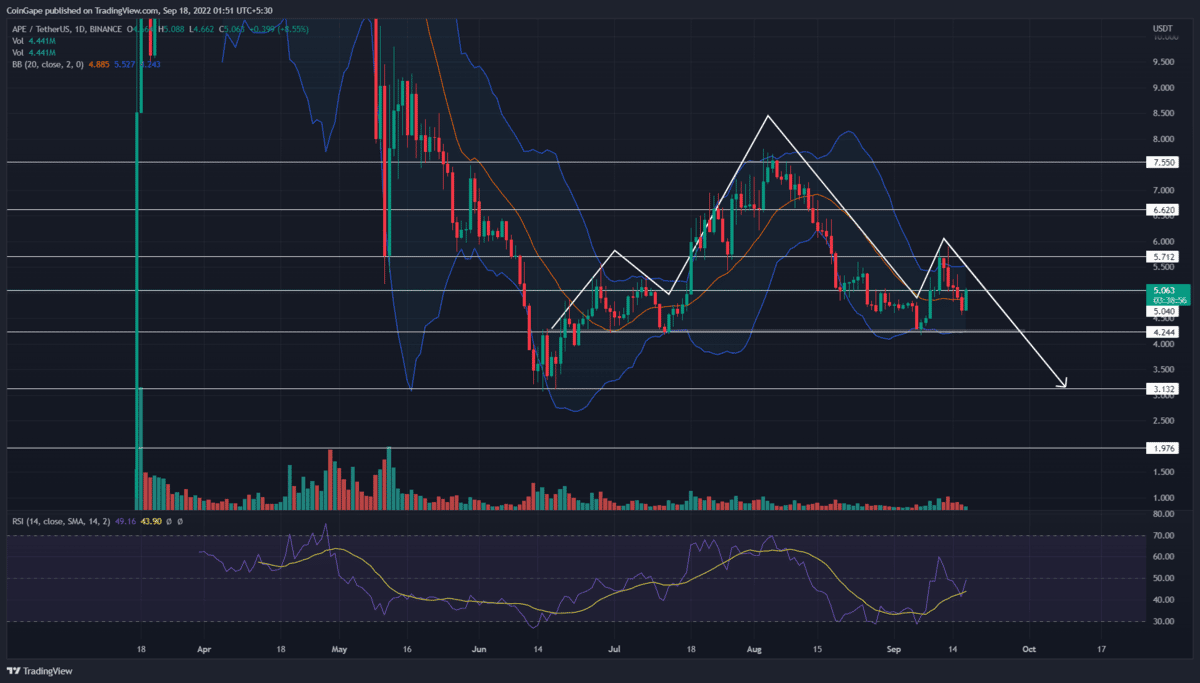
The V-Top reversal from the $5.7 resistance plummeted the Apecoin price below the $5 support. The altcoin is currently in a retest phase, and the post-retest fall may pull the prices to $4.42 support. Moreover, this level also acts as neckline support for head and shoulder pattern.
Key points Apecoin price analysis:
- The post-retest fall may plunge the price by 15%
- The 20-day EMA offers dynamic resistance to Apecoin priceApecoin price
- The intraday trading volume in Apecoin is $157.6 Million, indicating a 20.8% gain

Source-Tradingview
The Apecoin daily technical chart shows the formation of a head and shoulder pattern. This bullish pattern is often found in market tops as the prices display a trend reversal, switching from higher high formation to lower low formation.
Amid the recent sell-off in the crypto market, the altcoin turned down from the $5.7 resistance and bolstered the right shoulder portion of the pattern. The four-consecutive red candles registered a 19% loss and plug prices to $4.57 marked low.
Also read: Just-In: ApeCoin (APE) Community Gets Its Separate BAYC NFT Marketplace
Furthermore, the falling prices break a 20-day EMA and the local support of $5, indicating the sellers aim for another leg down. However, today, the coin is 7% and retests the breached resistance of $5.7.
However, the bullish candle aligned with lesser volume indicates weakness in bearish momentum. Thus, if the selling pressure persists, the Apecoin price may revert from the $5.5 resistance and breach the neckline support of $4.24.
A bearish breakdown from this pattern would accelerate the bullish momentum and challenge the June bottom support of 4.2%. The Apecoin price could reach the $2 mark per technical set-up.
On a contrary note, a daily candle above $5.7 will undermine the bearish pattern.
Technical Indicator
Bollinger band: the coin price breach the pattern’s midline from below, suggesting the buyers are looking for trend control. This mean line may also act as a dynamic resistance.
RSI indicator: the daily-RSI slope nosedived below the neutral line indicates the bearish sentiment building up among market participants.
- Resistance levels: $5.4 and $6
- Support levels: $4.2 and $3.2

Why Trust CoinGape
CoinGape has covered the cryptocurrency industry since 2017, aiming to provide informative insights Read more…to our readers. Our journal analysts bring years of experience in market analysis and blockchain technology to ensure factual accuracy and balanced reporting. By following our Editorial Policy, our writers verify every source, fact-check each story, rely on reputable sources, and attribute quotes and media correctly. We also follow a rigorous Review Methodology when evaluating exchanges and tools. From emerging blockchain projects and coin launches to industry events and technical developments, we cover all facets of the digital asset space with unwavering commitment to timely, relevant information.


