HT Price Analysis: What Next After a 30% Jump in Huobi Price?


Following the June end sell-off, the HT/USDT pair cushioned at the $4.3 mark, which supported the price for the past seven weeks. During this period, the technical chart revealed the formation of a descending triangle pattern and threatened further price fall. However, while the crypto market is making recovery efforts, the HT price gave a bullish breakout from this triangle on August 10th.
Key points
- Today’s candle closing is important for buyers to validate a potential rally in the near future.
- A breakdown from $4.66 would indicate weakness in buyers’ commitment.
- The intraday trading volume in the HT is $42 Million, indicating a 273% gain.
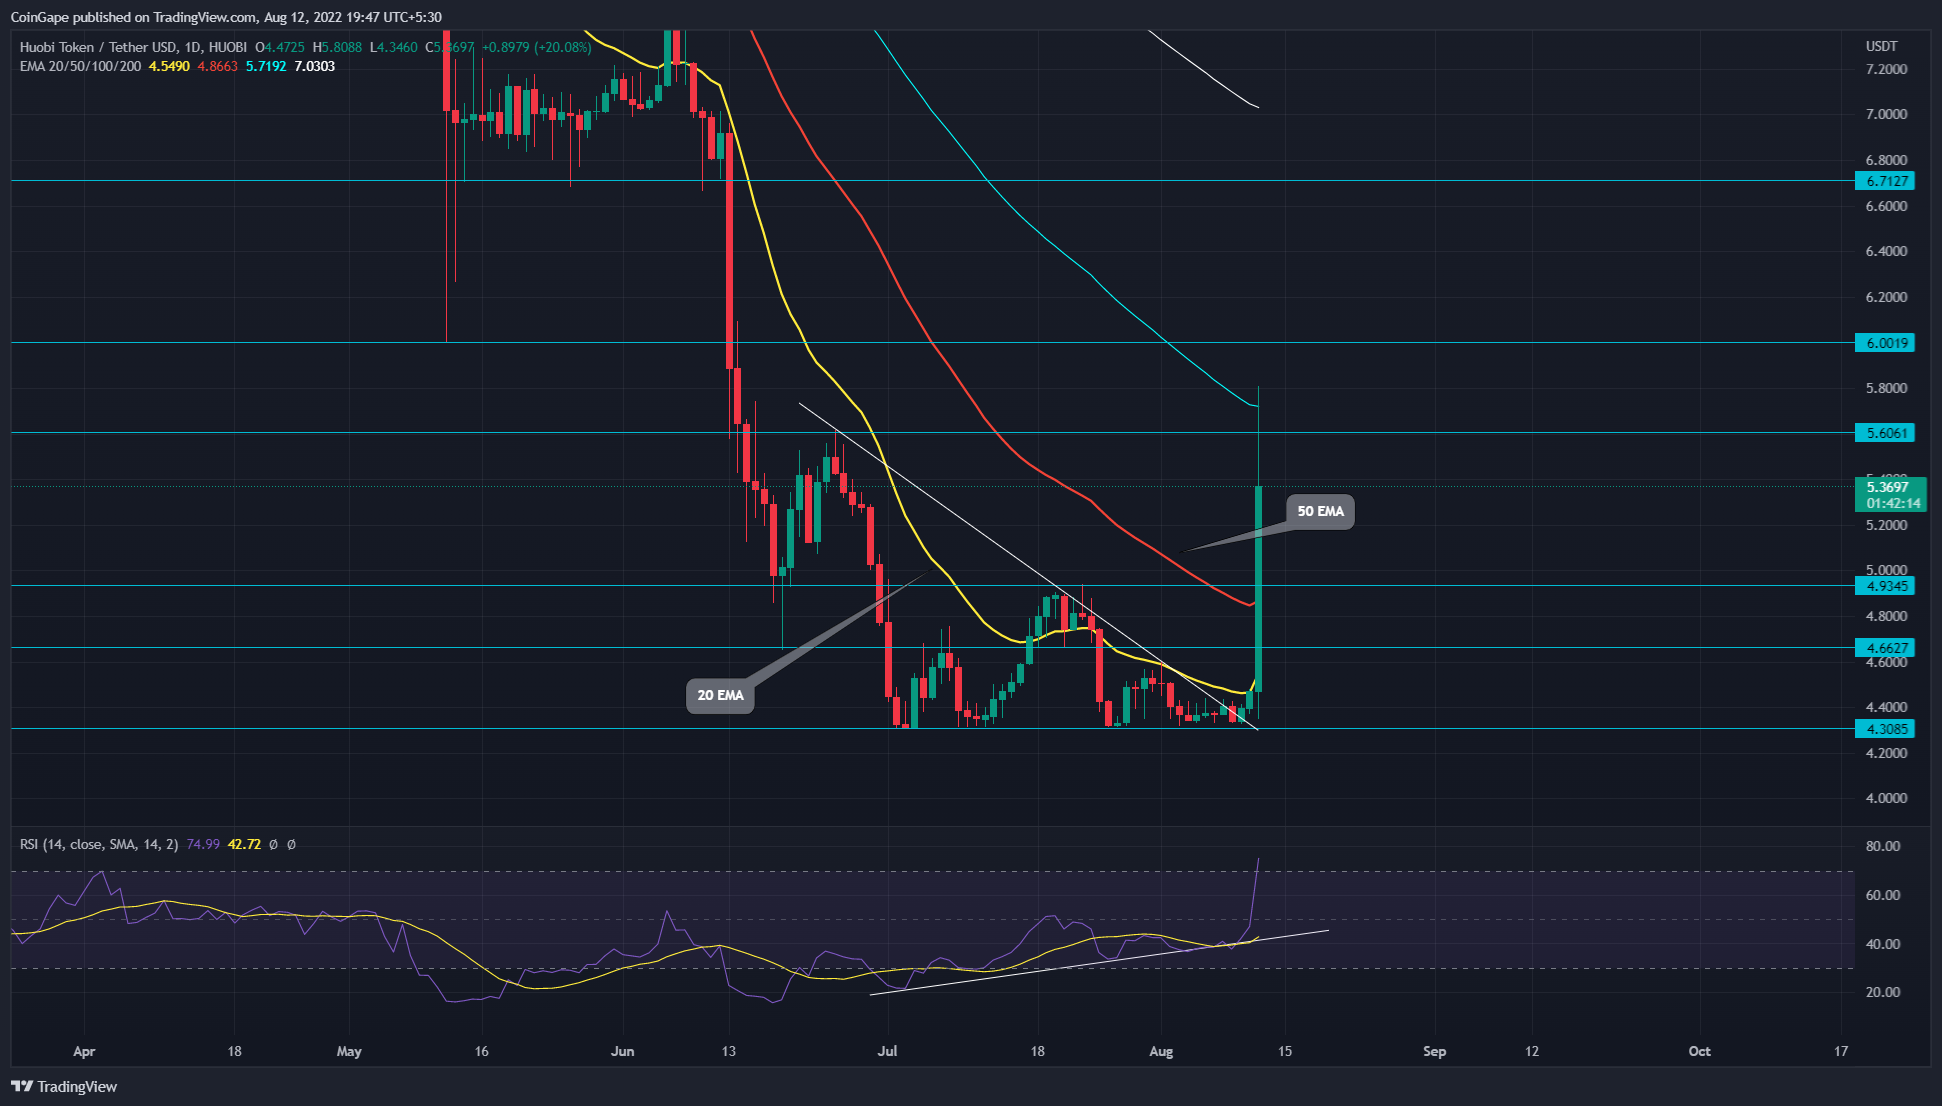 Source- –Tradingview
Amid the pattern breakout, fresh news that Huobi’s founder seeks to sell a 60% Stake triggered a significant price jump in the last 24 hours.
Anticipating the new shareholder will allow the exchange to gain more power and resources; the HT price surged 30% earlier today. The massive bullish engulfing candle breached the $4.66, $4.93, and $5.6 barriers in one strike.
However, the profit booking from short-term traders has reflected a long-wick rejection and pulled the altcoin to its current price of $5.29. Thus, coin traders should keep an eye on the daily candle closing, which would bolster further growth potential for HT price.
If the coin price gives a candle closing above the $4.93-$4.9 level, the buyers will obtain a suitable footing to sustain the higher price levels. Furthermore, a retracement to the $4.9 mark is plausible after the sudden price jump, which may offer an entry opportunity for sidelined buyers who missed today’s run-up.
Thus, if the altcoin shows sustainability above the aforementioned level, the post-retest rally may rechallenge the $5.6 resistance. A breakout from this level will extend the recovery to the next significant supply zone at $6.
Technical Indicators
EMAs: today’s price has reclaimed the 20-and-50-day EMA slope, offering an extra edge to coin buyers. Moreover, these breached EMAs are likely to flip to viable support levels.
RSI indicator: The daily-RSI slope surged into the overbought region, indicating the trader has overextended their buying in quite a short period. Thus, the momentum indicator supports a reversal to the $4.9 support level.
- Resistance levels- $5.6 and $6
- Support levels- $4.9 and $4.66
Why Trust CoinGape
CoinGape has covered the cryptocurrency industry since 2017, aiming to provide informative insights Read more…to our readers. Our journal analysts bring years of experience in market analysis and blockchain technology to ensure factual accuracy and balanced reporting. By following our Editorial Policy, our writers verify every source, fact-check each story, rely on reputable sources, and attribute quotes and media correctly. We also follow a rigorous Review Methodology when evaluating exchanges and tools. From emerging blockchain projects and coin launches to industry events and technical developments, we cover all facets of the digital asset space with unwavering commitment to timely, relevant information.


Will Bitcoin reach $250,000 by December 31, 2026?