Is Dogecoin Price Ready to Reclaim $0.1?


Dogecoin Price Analysis: Defying the bearish market sentiment in the crypto market the DOGE-themed memecoin continues its recovery rally to higher chart levels. With a series of new higher highs and lows, the coin price shows a sustained uptrend in the daily chart. Amid this recovery the buyers recently breached a monthly resistance of $0.075, suggesting the DOGE price could prolong the forward march.
Also Read: Launchpad XYZ Crypto Signals Telegram Group Longs Dogecoin Price, Target $0.15
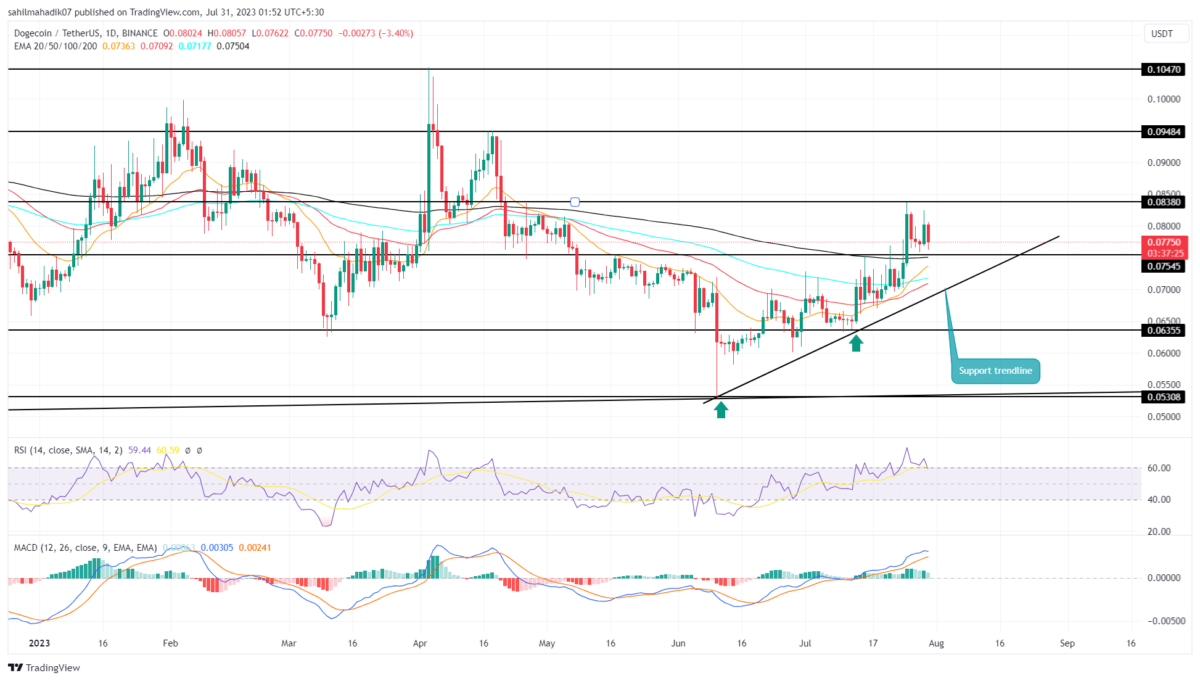
Dogecoin Price Daily Chart
- An ascending trendline bolsters the current recovery for Dogecoin
- A bullish crossover between the 20-and-200-day EMAs may lure more buyers into the market
- The 24-hour trading volume in the Dogecoin coin is $458.5 Million, indicating an 8% gain
 Source-Tradingview
After making a high of $0.083, the Dogecoin price reverted immediately and tried to retest the recently breached $0.754 resistance as potential support. On July 29th, the coin price bounced back from the aforementioned support with a long bullish candle indicating the buyers are accumulating at the new reclaimed support.
Today, the coin price plunged to the 0.0792 mark and showed an intraday loss of 3%. If the daily manages to sustain a hold above the half point($0.787) of the above-mentioned green candle, the coin holders would get additional confirmation of a sustained reversal.
With sustained buying, the coin buyers would rechallenge the last swing high of $0.083. A bullish breakout above this barrier would hint at uptrend resumption and may push the memecoin’s market value 21.7% to hit $0.095.
Can DOGE Price go Back to $0.635?
If the overhead supply pressure persists, the DOGE holders could witness a pullback to the rising support trendline. In the last seven weeks, the coin price rebounded twice from this support indicating a strong accumulation zone to ride the ongoing recovery. However, if sellers break this dynamic support the accelerated supply pressure could tumble the prices back to $0.635
- Exponential moving average: The coin price trading above the daily EMAs(20, 50, 100, and 200) indicates the buyers hold multiple support to maintain a recovery state
- Moving Average Convergence Divergence: A positive crossover state between the MACD(blue) and signal(orange) slope reflects the bullish momentum is active.

Why Trust CoinGape
CoinGape has covered the cryptocurrency industry since 2017, aiming to provide informative insights Read more…to our readers. Our journal analysts bring years of experience in market analysis and blockchain technology to ensure factual accuracy and balanced reporting. By following our Editorial Policy, our writers verify every source, fact-check each story, rely on reputable sources, and attribute quotes and media correctly. We also follow a rigorous Review Methodology when evaluating exchanges and tools. From emerging blockchain projects and coin launches to industry events and technical developments, we cover all facets of the digital asset space with unwavering commitment to timely, relevant information.

Related Articles


- Michael Saylor Says Quantum Risk To Bitcoin Is a Decade Away, Describes it as ‘FUD’
- White House Proposes Stablecoin Rewards Compromise as CLARITY Act Odds Drop to 44%
- Trump’s Board Of Peace Eyes Dollar-Backed Stablecoin For Gaza Rebuild
- Trump’s World Liberty Financial Flags ‘Coordinated Attack’ as USD1 Stablecoin Briefly Depegs
- Trump Tariffs: U.S. Threatens Higher Tariffs After Supreme Court Ruling, BTC Price Falls
- COIN Stock Risks Crashing to $100 as Odds of US Striking Iran Jump
- MSTR Stock Price Predictions As Michael Saylor’s Strategy Makes 100th BTC Purchase
- Top 3 Meme Coins Price Prediction As BTC Crashes Below $67k
- Top 4 Reasons Why Bitcoin Price Will Crash to $60k This Week
- COIN Stock Price Prediction: Will Coinbase Crash or Rally in Feb 2026?
- Shiba Inu Price Feb 2026: Will SHIB Rise Soon?


