Is ETH Price Heading to $1500? Key Indicator Speaks Out


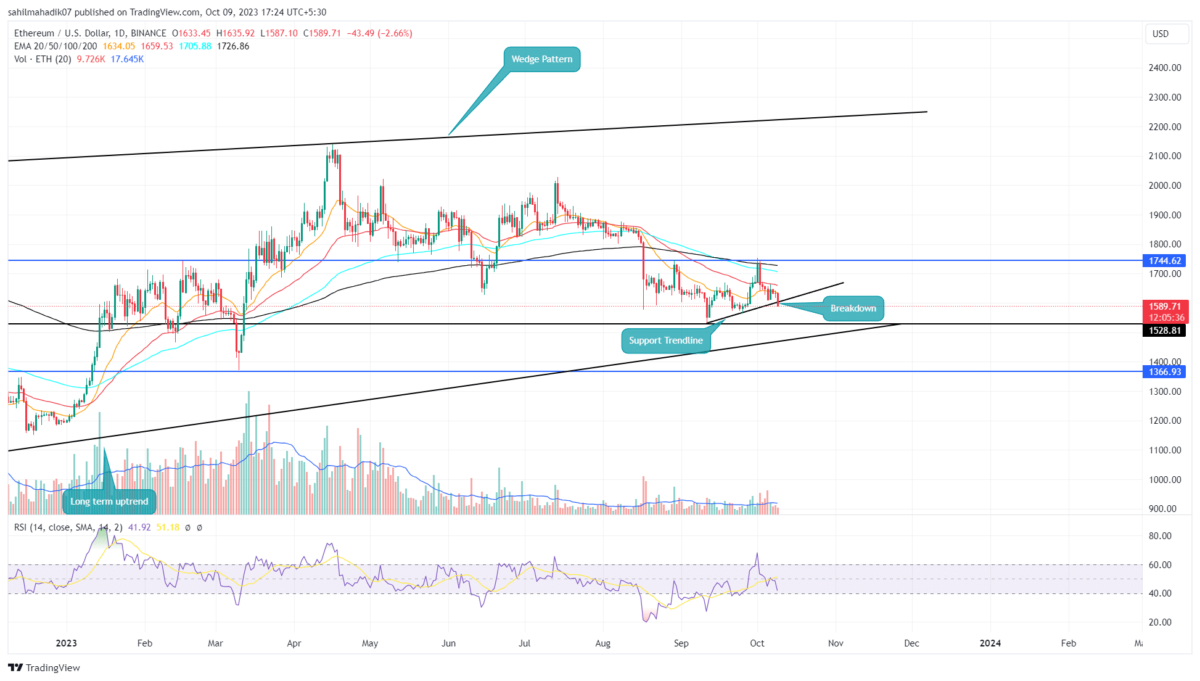
In light of the recent crypto market turbulence, the ETH price trajectory took a sharp downturn, retracting from its weekly resistance pegged at $1,744. This descent, accounting for an 8% drop in a fortnight, positions the coin at its present rate of $1,574. Amidst this slip, the crypto sellers breached below an emerging support trendline, suggesting the potential for an extended slide to the $1,500 benchmark.
Also Read: Ethereum News: Vitalik Buterin Moves $1.64 Million In ETH To Bitstamp
Support Breakout Hints Price Drop to $1500
- A bearish breakdown from the support trendline hints at a 6% drop in the near term.
- A rising wedge pattern leads to the current bullish trend in ETH price.
- The intraday trading volume in Ether is $4.4 Billion, indicating a 53% gain.
 Source- Tradingview
Over the last sixty days, the Ethereum price dynamics have been predominantly range-bound, oscillating between the $1,744 ceiling and a floor set at $1,530. This period of consolidation witnessed crypto buyers capitalizing on a new support trendline to bolster bullish momentum.
However, this optimism was momentarily curtailed as the recent market headwinds steered ETH price into a bearish breakout from this dynamic support. If today’s candle concludes below this pivotal trendline, it could encourage the selling pressure, potentially driving Ether downwards by another 6%, targeting the $1,500 mark.
This dip could then align with the longstanding support trendline of an established rising wedge formation
Will ETH Price Resume Recovery Trend?
A look at the weekly time frame chart shows the ongoing correction in Ethereum price which was initiated in mid-April is part of a long coming wedge pattern. Under the influence of this pattern, the coin price is resonating between two rising trendlines. With the recent correction, the coin price is likely to hit the pattern’s lower trendline around $1500. Historically, each retest to this support has led to a significant upswing, and therefore, the ETH price is likely to witness a surge in bullish momentum at this support. The anticipated upswing could bolster the coin price for a sustained recovery.
- Relative Strength Index: Despite the consolidation phase in price action, the RSI slope rising higher reflects the buyers’ attempt to reclaim higher levels. However, this failed effort to reflect the sellers may remain dominant and prolong the ongoing correction phase
- Exponentially Moving Average: The recent downturn from the 200 EMA slope, indicates a downward trend active.

Why Trust CoinGape
CoinGape has covered the cryptocurrency industry since 2017, aiming to provide informative insights Read more…to our readers. Our journal analysts bring years of experience in market analysis and blockchain technology to ensure factual accuracy and balanced reporting. By following our Editorial Policy, our writers verify every source, fact-check each story, rely on reputable sources, and attribute quotes and media correctly. We also follow a rigorous Review Methodology when evaluating exchanges and tools. From emerging blockchain projects and coin launches to industry events and technical developments, we cover all facets of the digital asset space with unwavering commitment to timely, relevant information.
24 Hours volume
$4.3B
Market Cap
$247.47B
Max Supply
NA


