Is Ethereum($ETH) Price Falling Back to $1800? A Golden Chance To Buy The Dip?


The crypto market has made a remarkable recovery over the past week, with Bitcoin showing a notable gain of 15.65%. However, altcoins are giving indications of a potential short-term slowdown as profit-taking activities start to take place. Ethereum, despite experiencing an 8.6% jump, has encountered increased resistance in the last couple of days, suggesting a possible decline.
Also Read: Powell Says “Pause” Is Temporary; Expert Reveals Reason Behind Bitcoin, Ethereum, Altcoins Rally
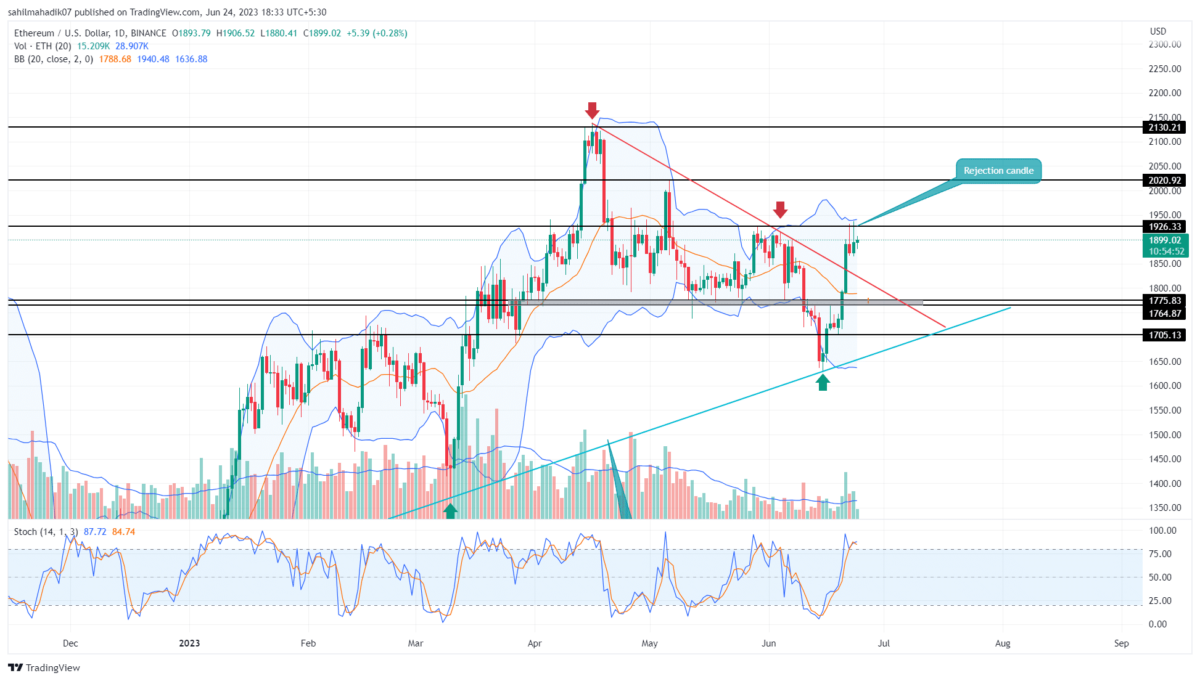
Ethereum Price Daily Chart
- The Higher price rejection candles at $1939 reflect a strong supply pressure at this level
- The Ethereum price at $1891 could see a pullback to retest the $1800 mark.
- The intraday trading volume in Ether is $7.9 Billion, indicating an 28% gain.
 Source- Tradingview
Ethereum price is currently trading around $1891 and facing resistance at $1939. It has been struggling to break through the upper Bollinger Band, forming a pattern that resembles a tweezer top. This pattern suggests a possible market reversal.
But here’s the interesting part. This retest could actually be an opportunity for buyers, as the price seems ready for a rebound. The recent low trading volume supports the idea of a reversal after the retest.
For Ethereum to maintain its bullish momentum, it needs to stay above the opening level of $1792 from June 21, which would represent a 5.43% increase. Now, the big question is whether Ethereum can reclaim the $2000 mark.
Will $ETH Price Rise Back to $2000?
There’s a chance we might see a pullback to the previously broken trendline, which could give buyers a breather before the recovery picks up steam again. If Ethereum can hold above this support level, we could witness a significant surge of 13.8%, pushing it to reach its 2023 peak of $2138.
- Stochastic: The Stochastic lines are currently in oversold territory, but they’re on the verge of a reversal after a bearish crossover.
- Bollinger Bands: The upper band of the Bollinger Band, which is currently around $1939, adds to the resistance, setting the stage for a potential bearish reversal.

Why Trust CoinGape
CoinGape has covered the cryptocurrency industry since 2017, aiming to provide informative insights Read more…to our readers. Our journal analysts bring years of experience in market analysis and blockchain technology to ensure factual accuracy and balanced reporting. By following our Editorial Policy, our writers verify every source, fact-check each story, rely on reputable sources, and attribute quotes and media correctly. We also follow a rigorous Review Methodology when evaluating exchanges and tools. From emerging blockchain projects and coin launches to industry events and technical developments, we cover all facets of the digital asset space with unwavering commitment to timely, relevant information.

Related Articles


- US Strike on Iran Possible Within Hours: Crypto Market on High Alert
- MetaSpace Will Take Its Top Web3 Gamers to Free Dubai Trip
- XRP Seller Susquehanna Confirms Long-Term Commitment to Bitcoin ETF and GBTC
- Vitalik Buterin Offloads $3.67M in ETH Amid Ethereum Price Decline
- Crypto Market Crash: Here’s Why Bitcoin, ETH, XRP, SOL, ADA Are Falling Sharply
- COIN Stock Price Prediction: Will Coinbase Crash or Rally in Feb 2026?
- Shiba Inu Price Feb 2026: Will SHIB Rise Soon?
- Pi Network Price Prediction: How High Can Pi Coin Go?
- Dogecoin Price Prediction Feb 2026: Will DOGE Break $0.20 This month?
- XRP Price Prediction As SBI Introduces Tokenized Bonds With Crypto Rewards
- Ethereum Price Rises After SCOTUS Ruling: Here’s Why a Drop to $1,500 is Possible


