KuCoin Price Analysis: KCS Price Prepares To Kickstart Another Recovery; Ready To Buy?


On February 24th, the KCS/USDT pair showed a long-tailed rejection from the $17.7 support, indicating the buyers are aggressively defending this level. The KCS price has turned green today, challenging the immediate resistance of $18.9. Can buyers surpass the overhead resistance to initiate their recovery rally?
Key technical points:
- The KCS price wavering between the 100-and-200 EMA
- The 24-hour trading volume in the KuCoin token is $14.6 Million, indicating a 41.3% loss.
KuCoin Community Chain(KCC) Launches a $50M Ecosystem Accelerator Program
The KCC announced a $50 million accelerator program to empower projects in its ecosystem. Developers can build innovative platforms on the KCC network containing integrations that offer technical assistance, marketing, investment, incubation, liquidity support, and listing opportunities.
According to KCC, this program holds four components, i.e., Builders’ Bounty, Project Contests/Hackathon, Project incubation fund, and Liquidity support.
Amidst the announcement, the KCS price soars 4% today, suggesting a recovery opportunity on the cards.
Let us study the KCS/USDT technical chart to understand price behavior.
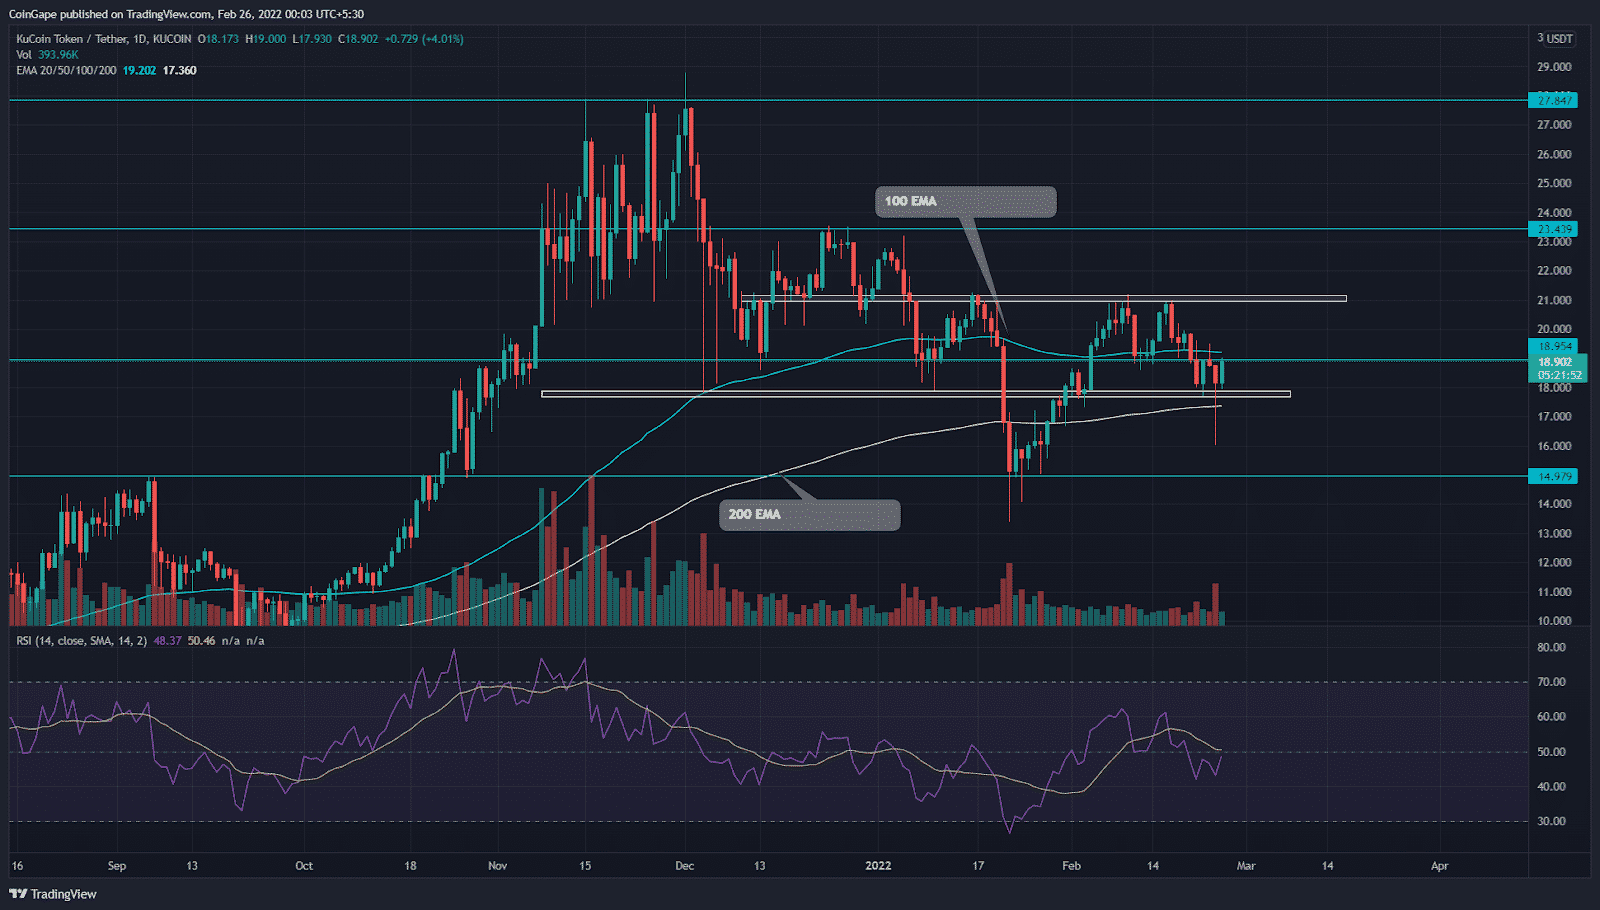
On February 16th, the KCS buyers failed on their second attempt to pierce the swing high resistance of $21. The resulting evening star candle pattern tumbled the altcoin by 9%, bringing it to the $18.9 local support.
The technical revealed a double top pattern breakout from the $18.9 neckline on Feb 21st, which intensified the ongoing selling pressure. On Feb 24th, the sellers attempted to follow up on this breakdown and pull the price below $17.7 support. However, intense buying pressure accounted for a 13% long-tail rejection, resulting in a daily-candle closing above the $17.7 mark.
Today, the KCS price is 4% up and challenges the shared resistance of $18.9 and 100-day EMA. A bullish breakout from this level provides a first signal to recovery and a potential gain of 10%, reaching the $21 mark.
On a contrary note, if sellers slip the altcoin below the bottom support($17.7), the coin price would retest the January low support($15).
KCS Technical indicator Analysis
The flattish 100 and 200-day EMA indicates a sideways rally. Furthermore, the KCS price has been sandwiched between these EMAs, providing an additional confirmation upon the breakout from either of these levels.
The Relative Strength Index(60) slope is on the verge of crossing above the 14-SMA and midline, suggesting a positive turn in market sentiment.
- Resistance levels- $19 and $21
- Support levels- $17.7, $165

Why Trust CoinGape
CoinGape has covered the cryptocurrency industry since 2017, aiming to provide informative insights Read more…to our readers. Our journal analysts bring years of experience in market analysis and blockchain technology to ensure factual accuracy and balanced reporting. By following our Editorial Policy, our writers verify every source, fact-check each story, rely on reputable sources, and attribute quotes and media correctly. We also follow a rigorous Review Methodology when evaluating exchanges and tools. From emerging blockchain projects and coin launches to industry events and technical developments, we cover all facets of the digital asset space with unwavering commitment to timely, relevant information.

Related Articles


- Michael Saylor Says Quantum Risk To Bitcoin Is a Decade Away, Describes it as ‘FUD’
- White House Proposes Stablecoin Rewards Compromise as CLARITY Act Odds Drop to 44%
- Trump’s Board Of Peace Eyes Dollar-Backed Stablecoin For Gaza Rebuild
- Trump’s World Liberty Financial Flags ‘Coordinated Attack’ as USD1 Stablecoin Briefly Depegs
- Trump Tariffs: U.S. Threatens Higher Tariffs After Supreme Court Ruling, BTC Price Falls
- COIN Stock Risks Crashing to $100 as Odds of US Striking Iran Jump
- MSTR Stock Price Predictions As Michael Saylor’s Strategy Makes 100th BTC Purchase
- Top 3 Meme Coins Price Prediction As BTC Crashes Below $67k
- Top 4 Reasons Why Bitcoin Price Will Crash to $60k This Week
- COIN Stock Price Prediction: Will Coinbase Crash or Rally in Feb 2026?
- Shiba Inu Price Feb 2026: Will SHIB Rise Soon?


