LUNA Price Prediction: Regains Upside Traction Near $95.0; Attempt To Revisit Record Highs Above $104.0


LUNA price extend the previous session gains and started the fresh trading week on a higher note. Although the price faces some upside pressure at the session’s high the downside risk seems limited for the asset.
- LUNA price edges higher on Monday with remarkable gains.
- A decisive close above $95.0 aims for an all-time high next.
- Downside risk remains limited at $85.0.
As of publication time, LUNA/ USD is exchanging hands at $92.61, up 5.96% for the day. The seventh-largest cryptocurrency by market cap holds 24-hour trading volume at $3,425,875,156 with more than 83% gains as per the CoinMarketCap.
Generally, a rise in price with increased trading volume is a sign of strength in the price.
LUNA price moves north
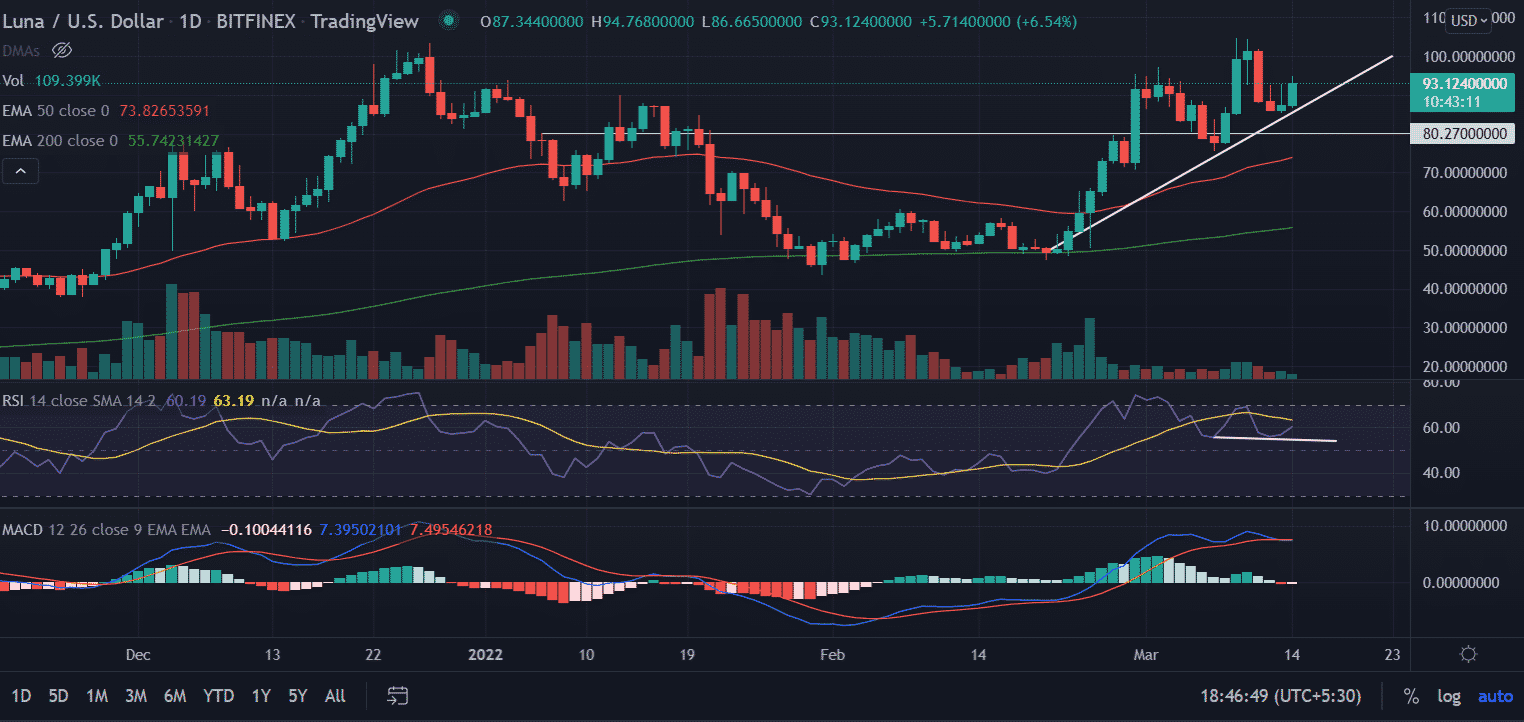
On the daily chart, LUNA price is rising along the ascending trendline, which is extending from the lows of $50.71 that also coincides with the critical-200 EMA (Exponential Moving Average) at $49.65. Further, the asset pierced another crucial hurdle of 50-day EMA at $50.67. LUNA price surged more than 100% since February 20 bucking the broader crypto market trend.
Currently, LUNA’s price is facing some upside barrier near the $93.0-$95.0 zone. A resurgence in the buying pressure would push the price toward higher territories aiming for the first target at all-time highs of $104.57.
Next, an extended buying momentum will attempt to test the next all-time-high level at the psychological $110.0 barrier.
On the flip side, a break of the bullish slop line will invalidate the bullish theory. On the downside LUNA price dive toward the $80.0 horizontal support level. Below that sellers will further collect the liquidity around the $70.0 demand zone.
Technical indicators:
RSI: The Daily Relative Strength index is giving negative divergence and trades below the average line. Any downtick in the indicator could push the price lower.
MACD: The Moving Average Convergence Divergence (MACD) is oscillating above the midline with a neutral bias.

Why Trust CoinGape
CoinGape has covered the cryptocurrency industry since 2017, aiming to provide informative insights Read more…to our readers. Our journal analysts bring years of experience in market analysis and blockchain technology to ensure factual accuracy and balanced reporting. By following our Editorial Policy, our writers verify every source, fact-check each story, rely on reputable sources, and attribute quotes and media correctly. We also follow a rigorous Review Methodology when evaluating exchanges and tools. From emerging blockchain projects and coin launches to industry events and technical developments, we cover all facets of the digital asset space with unwavering commitment to timely, relevant information.

Related Articles


- Bitcoin Price Today As Bulls Defend $65K–$66K Zone Amid Geopolitics and Tariffs Tensions
- XRP Realized Losses Spike to Highest Level Since 2022, Will Price Rally Again?
- Crypto Market Rises as U.S. and Iran Reach Key Agreement On Nuclear Talks
- Trump Tariffs: U.S. Raises Global Tariff Rate To 15% Following Supreme Court Ruling
- Bitwise CIO Names BTC, ETH, SOL, and LINK as ‘Mount Rushmore’ of Crypto Amid Market Weakness
- Pi Network Price Prediction: How High Can Pi Coin Go?
- Dogecoin Price Prediction Feb 2026: Will DOGE Break $0.20 This month?
- XRP Price Prediction As SBI Introduces Tokenized Bonds With Crypto Rewards
- Ethereum Price Rises After SCOTUS Ruling: Here’s Why a Drop to $1,500 is Possible
- Will Pi Network Price See a Surge After the Mainnet Launch Anniversary?
- Bitcoin and XRP Price Prediction As White House Sets March 1st Deadline to Advance Clarity Act


