PEPE Price Analysis: Double Bottom Pattern Sets Pepe Coin for 28% Rally


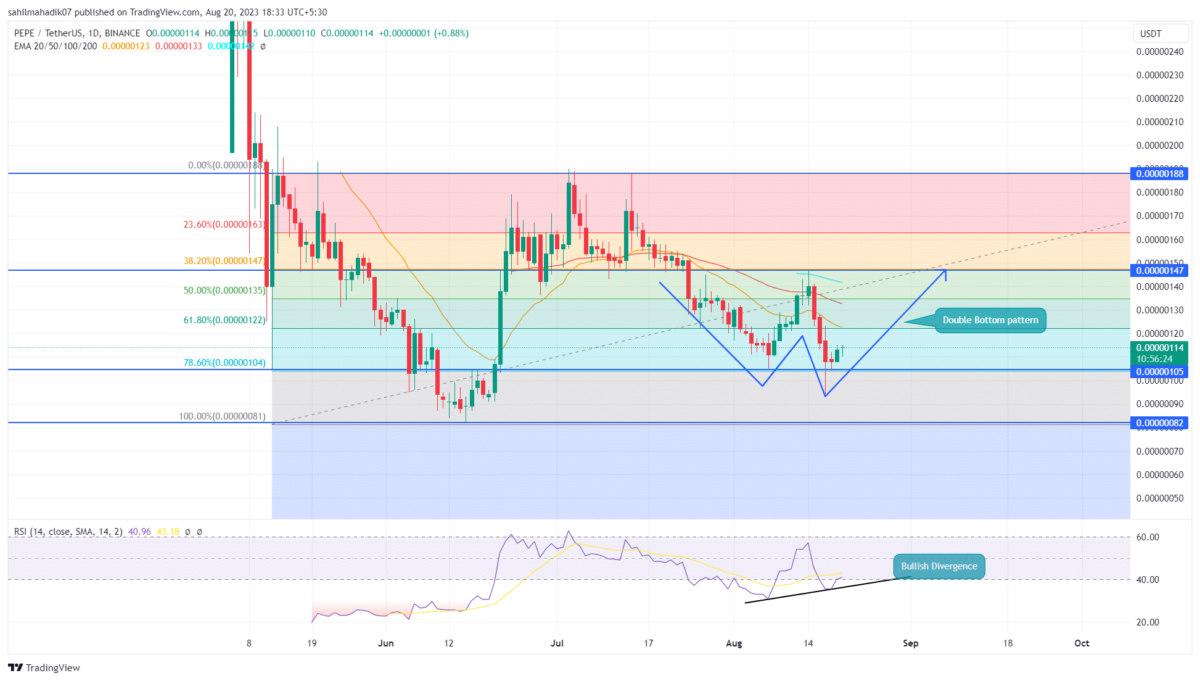
The Frog-themed memecoin PEPE started witnessing aggressive selling pressure from mid-August, leading to a sharp reversal from the $0.00000147 mark. This downfall bolstered by a broader market sell-off triggered a 29% drop and pushed the prices back to $0.00000105 local support. The PEPE price sustainability at this support accentuates the investors accumulating at a discounted price and the potential for a bullish rebound.
Also Read: Pepe Coin Leads Crypto Recovery; PEPE Price Jumps By 5%
Pepecoin Daily Chart: Key Points
- The PEPE price witnessed high demand pressure at the $0.00000105 mark
- A bulls divergence in the daily RSI shop reflects the underlying bullish momentum is rising
- The 24-hour trading volume in the Pepe coin is $67.9 Million, indicating a 14.5 % loss.
 Source- Tradingviewr
After the early week sell-off in the crypto market, the Pepe Coin buyers manage to sustain above the combined support of $0.00000105 and 78.6% Fibonacci retracement level. In the daily time frame chart the coin price shows a formation of a morning star at the aforementioned support indicating an upcoming reversal.
This second reversal from the PEPE price within a month indicates the potential development of a double bottom pattern. This chart pattern is often spotted at the bottom of a downtrend, leading to a sharp bullish recovery.
By the press time, the Pepe coin trades at $0.000113 with an intraday gain of 0.88%. Under the influence of this chart pattern, the anticipated upswing should lead the popular memecoin 28.8% higher to challenge the $0.00000147 neckline.
Is It The Right Time to Buy Pepe Coin?
In theory, a correction fall to 78.6% FIB level reflects some weakness in bullish momentum. Therefore, interested market participants must remain cautious and can wait for a break above the 0.00000147 neckline for a safer entry. This breakout will offer buyers a better confirmation for a bullish recovery and could push the prices back to a $0.00000188 swing high.
- Relative Strength Index: concerning the two bounce-backs from the $0.000105 support, the daily RSI slope shows an evident rise indicating a high possibility of price reversal.
- Exponential Moving Averages: The downsloping EMAs(20, 50, and 100) could exert in-between resistances before the buyers reach the $0.00000147 neckline.

Why Trust CoinGape
CoinGape has covered the cryptocurrency industry since 2017, aiming to provide informative insights Read more…to our readers. Our journal analysts bring years of experience in market analysis and blockchain technology to ensure factual accuracy and balanced reporting. By following our Editorial Policy, our writers verify every source, fact-check each story, rely on reputable sources, and attribute quotes and media correctly. We also follow a rigorous Review Methodology when evaluating exchanges and tools. From emerging blockchain projects and coin launches to industry events and technical developments, we cover all facets of the digital asset space with unwavering commitment to timely, relevant information.

Related Articles


- XRP Realized Losses Spike to Highest Level Since 2022, Will Price Rally Again?
- Crypto Market Rises as U.S. and Iran Reach Key Agreement On Nuclear Talks
- Trump Tariffs: U.S. Raises Global Tariff Rate To 15% Following Supreme Court Ruling
- Bitwise CIO Names BTC, ETH, SOL, and LINK as ‘Mount Rushmore’ of Crypto Amid Market Weakness
- Prediction Market News: Kalshi Faces New Lawsuit Amid State Regulatory Crackdown
- Dogecoin Price Prediction Feb 2026: Will DOGE Break $0.20 This month?
- XRP Price Prediction As SBI Introduces Tokenized Bonds With Crypto Rewards
- Ethereum Price Rises After SCOTUS Ruling: Here’s Why a Drop to $1,500 is Possible
- Will Pi Network Price See a Surge After the Mainnet Launch Anniversary?
- Bitcoin and XRP Price Prediction As White House Sets March 1st Deadline to Advance Clarity Act
- Top 3 Price Predictions Feb 2026 for Solana, Bitcoin, Pi Network as Odds of Trump Attacking Iran Rise


