 Buy $GGs
Shiba Inu Price Analysis: Falling Wedge Pattern May Bring Dip Opportunity In SHIB Token


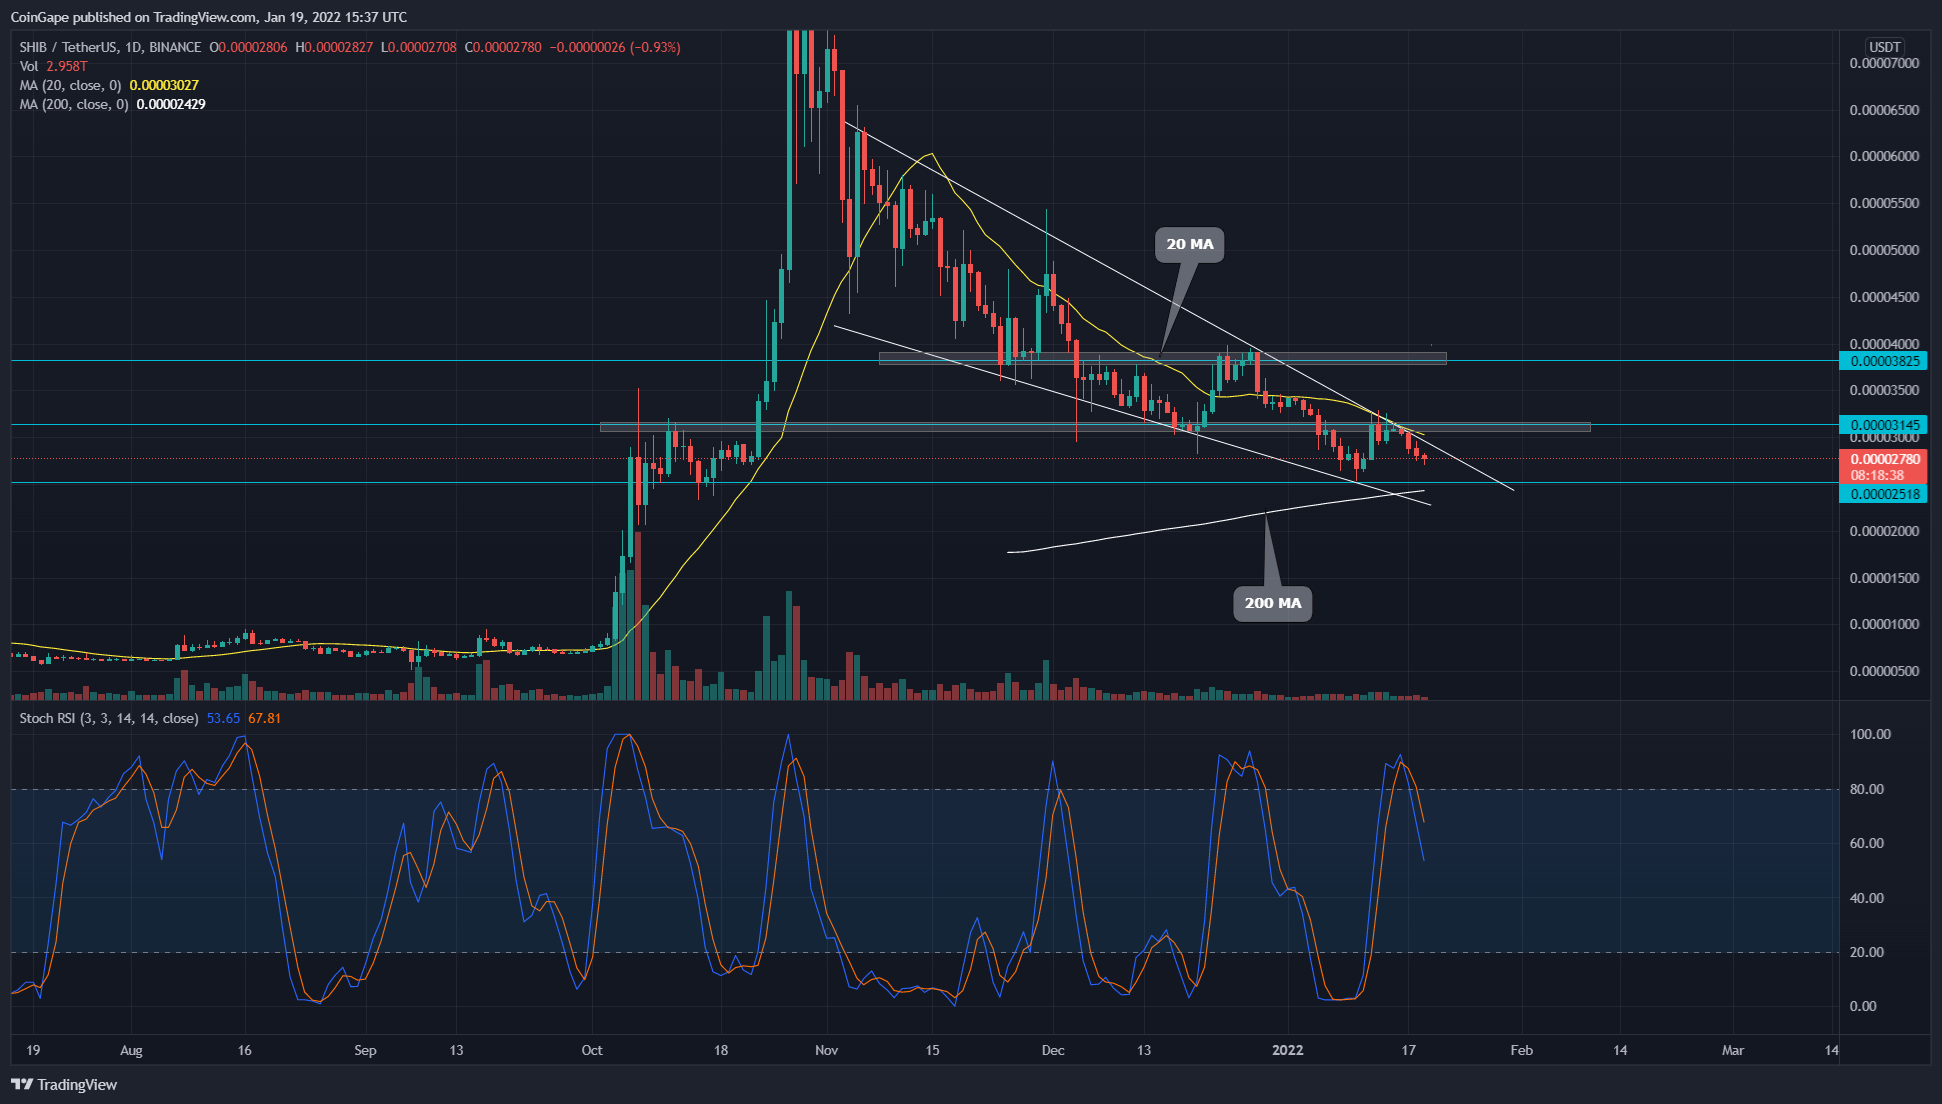
Shib Inu (SHIB) price has been under a correction phase for almost three months now. The SHIB price has lost 68% from the All-Time high of $0.0000883 and is still dropping lower under the influence of a falling wedge pattern. However, this pattern can provide a bullish opportunity if the price breaks free from its resistance trendline.
Key technical points:
- The daily- Stochastic RSI displays bearish divergence among the K and D line
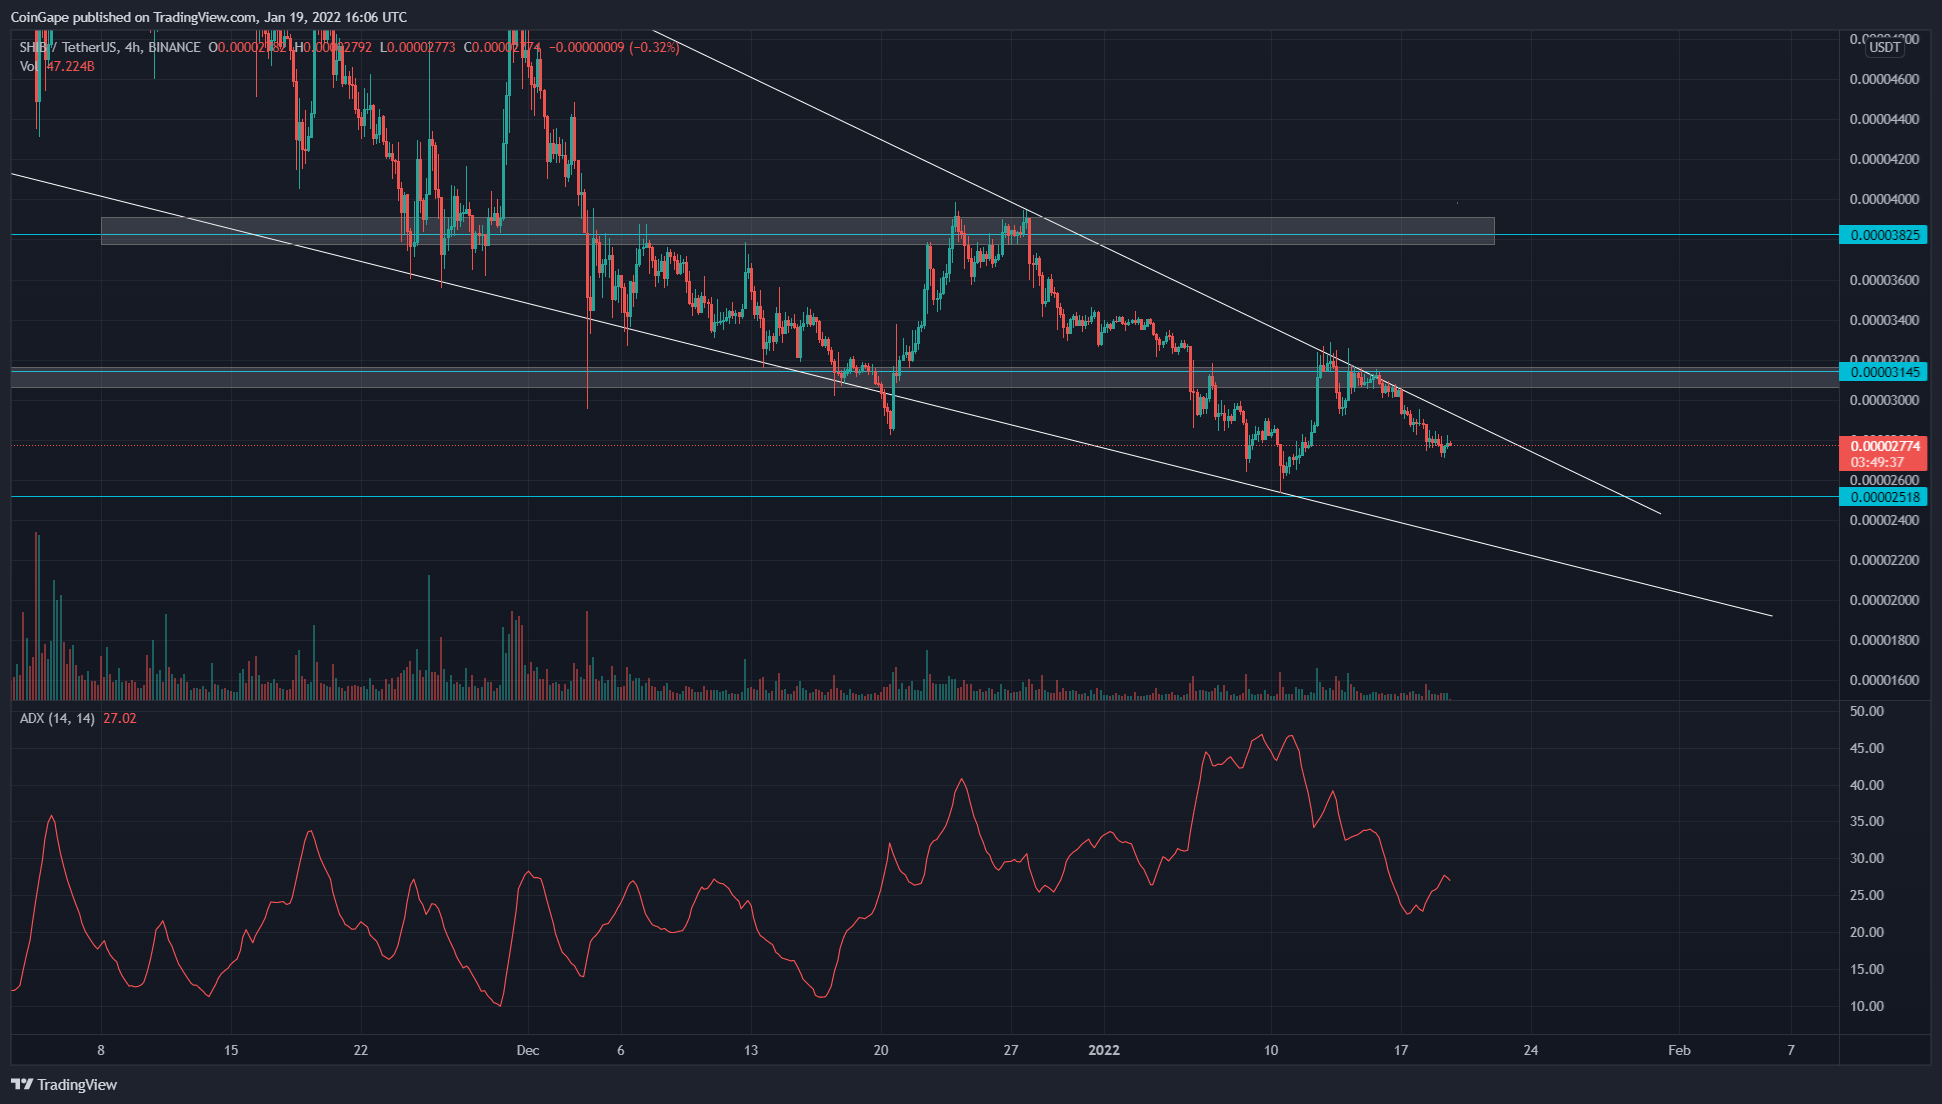
- The intraday trading volume in the SHIB token is $703.6 Million, indicating a 15.6% loss
 Source- Tradingview
Previously on our price analysis on Shib Inu, the SHIB/USD pair lost crucial support of $0.000003. The SHIB price was discounted by more than 16% and dropped to the $0.000025 mark. The combined support of this horizontal level and support trendline provided sufficient demand for a bullish reversal.
However, SHIB price was rejected from the overhead trendline of this pattern and started to fall again. The SHIB token price trading above the 200 MA line maintains its bullish trend. However, on the flipped side, the 20 MA is providing strong dynamic resistance to coin price.
The daily-Stochastic RSI shows a bearish crossover among the K and D lines, supporting the ongoing selling in the market.
SHIB Token Price Could Drop To $0.000025 Support
 Source- Tradingview
The SHIB price rejected from the $0.00003 resistance is steadily approaching the current lower support of $0.000025. If the price could breach this bottom support as well, the correction rally will extend and drop to even lower levels.
- On a contrary note, falling wedge patterns are also known for providing an excellent long trade opportunity, if the price breaks out from the overhead resistance trendline.
- The average directional movement index(27) slope has started rising again with respect to the falling, indicating the increasing selling momentum.
- The technical chart indicated the overhead resistance for SHIB is $0.00003, followed by 0.000038. On the flip side, the support levels are $0.25, and the 200-day MA
Play 10,000+ Casino Games at BC Game with Ease
- Instant Deposits And Withdrawals
- Crypto Casino And Sports Betting
- Exclusive Bonuses And Rewards


Why Trust CoinGape
CoinGape has covered the cryptocurrency industry since 2017, aiming to provide informative insights Read more…to our readers. Our journal analysts bring years of experience in market analysis and blockchain technology to ensure factual accuracy and balanced reporting. By following our Editorial Policy, our writers verify every source, fact-check each story, rely on reputable sources, and attribute quotes and media correctly. We also follow a rigorous Review Methodology when evaluating exchanges and tools. From emerging blockchain projects and coin launches to industry events and technical developments, we cover all facets of the digital asset space with unwavering commitment to timely, relevant information.

Related Articles


- ‘Iran Will Not Surrender’: Crypto Market Falls Again as US–Iran Tensions Rise
- Fed Vice Chair Michelle Bowman Calls for More Rate Cuts as U.S. Labor Data Disappoints
- CLARITY Act Likely to Pass by July, Says Kristin Smith
- Best Cross-Chain Swap Platforms in 2026 – Top 9 Picks Reviewed
- Crypto Traders Predict Oil Prices to Rally Above $100 as Iran War Enters Week 2
- Here’s Why Cardano Price Has Not Reclaimed $0.30
- Will XRP Price Crash as U.S. Nonfarm Payrolls Fell by 92,000 in February?
- Pi Network Price Eyes a 40% Surge as Pi Day Looms on March 14
- Top Reasons Why Circle Stock Price is Surging
- Gold Price Prediction as US-Iran War Hits the Second Week
- HOOD Stock Targets $100 as Robinhood Unveils Platinum Card and Advance Dividend Feature


