 Buy $GGs
SHIB Price Prediction: Triangle Setup Hints 8% Drop in Near Term


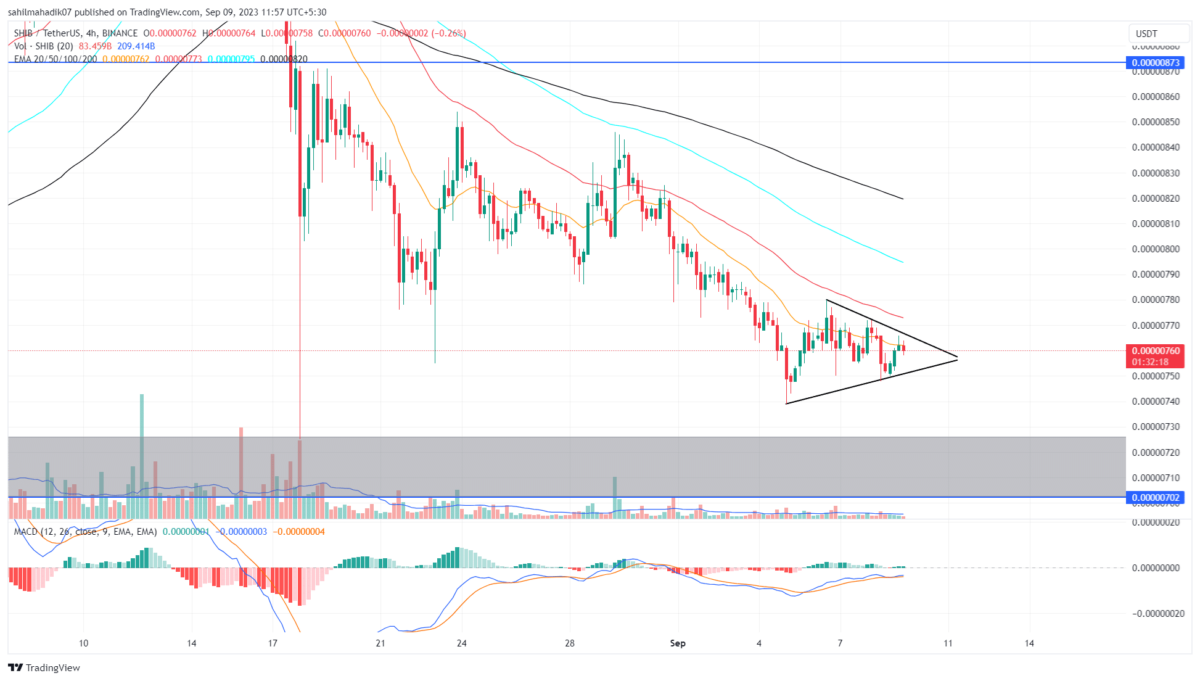
In the wake of volatile market sentiment, the Shiba Inu coin price has been navigating choppy waters. From August 30th, the coin price significantly dropped from a $0.000846 swing high and plunged to the $0.000000739 mark. After registering a 12.65% loss, the price action turned sideways in response to increasing uncertainty in the crypto market. However, a closer look at the four-time frame chart reflects this consolidation as forming a pennant pattern.
Also Read: SHIB Price Prediction: Shiba Inu Shows Signs Of New Lifeline, But There’s A Catch
Bearish Pennant Hints Continuation of Downward Trend.
- The Shib price narrowing within two trend lines will lead to a decisive breakout
- A breakdown below the support trendline could tumble the prices by 8%.
- The intraday trading volume of the Shiba Inu coin is $94 Million, showing a 5.7% gain.
 Source- Tradingview
A keen look in the 4-hour timeframe shows a better picture of the bearish pennant pattern. For the past week, the Shiba Inu coin seems to be dancing on a tightrope, oscillating between two converging trend lines that define this pattern.
At the time of writing, the altcoin valuation sits at $0.00000759, suffering a 0.2% intraday blow. Amplifying this bearish narrative are the high price rejection candles evident at the upper resistance, suggesting another bearish reversal on the horizon. This reversal would hint to extension of sideways movement.
However, gauging the prevailing sentiment, sellers might soon take the reins, potentially steering the coin beneath the pennant’s lower trendline. Should this bearish prophecy materialize, we could see the Shiba Inu price plunge 8%, testing the $0.000007 support.
Can SHIB Price Rise Back to $0.0000085?
While a bearish thesis seems valid for the SHIB price, the triangle pattern holds the possibility to reverse the prior trend. Therefore, if the coin price breaks above the upper trendline, the buyers may lead to a significant upswing, leading to $0.0000085.
- Bollinger Band: The narrow range of Bollinger band indicators accentuates indecisiveness sentiment among traders
- Moving Average Convergence Divergence: Despite an upswing in the MACD indicator, the price action making lower highs indicates the buyers are not marking a significant impact.
Play 10,000+ Casino Games at BC Game with Ease
- Instant Deposits And Withdrawals
- Crypto Casino And Sports Betting
- Exclusive Bonuses And Rewards


Why Trust CoinGape
CoinGape has covered the cryptocurrency industry since 2017, aiming to provide informative insights Read more…to our readers. Our journal analysts bring years of experience in market analysis and blockchain technology to ensure factual accuracy and balanced reporting. By following our Editorial Policy, our writers verify every source, fact-check each story, rely on reputable sources, and attribute quotes and media correctly. We also follow a rigorous Review Methodology when evaluating exchanges and tools. From emerging blockchain projects and coin launches to industry events and technical developments, we cover all facets of the digital asset space with unwavering commitment to timely, relevant information.

Related Articles


- Just-In: Trump Says Talks With Iran “Possible” Even as Tehran Rules Out Negotiations
- “Bitcoin Is Going to Die”- Hollywood Fame Terrence Howard Warns Bitcoin Investors
- Iran-US War News: Oil Prices Fall as Trump Draws Red Line on Strait of Hormuz
- Bitcoin News Today: BTC on the Verge of ‘Banana Split’, Peter Brandt Predicts Imminent Breakout
- Breaking: Trump Says The U.S.-Iran War Could End Soon, Mulls Taking Over Strait Of Hormuz
- Bitcoin Price Today: President Trump Signals Iran Conflict May End Soon As BTC Eyes $72k
- Top Analyst Explains Why Pi Network Price May Soar to $0.50 This Week
- Is MSTR Stock Going to Rally $150?
- Bitcoin And XRP Price Prediction As US Oil Prices Fall Sharply- Will This Spark a New Bull Rally?
- Is It a Good Time to Buy XRP As Price Falls 64% From All-time High
- Will Crypto Market Crash This Week? Analysts Predict Timeline for Volatility


