Shiba Inu Price Analysis: What’s Ahead for $SHIB Price After $0.0000083 Breakout?


Shiba Inu Price Analysis: On July 9th, the Shiba Inu price signaled an early sign of bullish recovery when it breached a long-coming resistance trendline. This dynamic resistance kept the popular memecoin in a downtrend over the past five months and plunged to a new year low of $0.00000543. As the crypto market gets back on recovery tracks, interested traders can look for entry opportunities from this breakout.
Also Read: Shiba Inu News: Largest Shiba Inu Whale Transfers 4 Trillion $SHIB Tokens
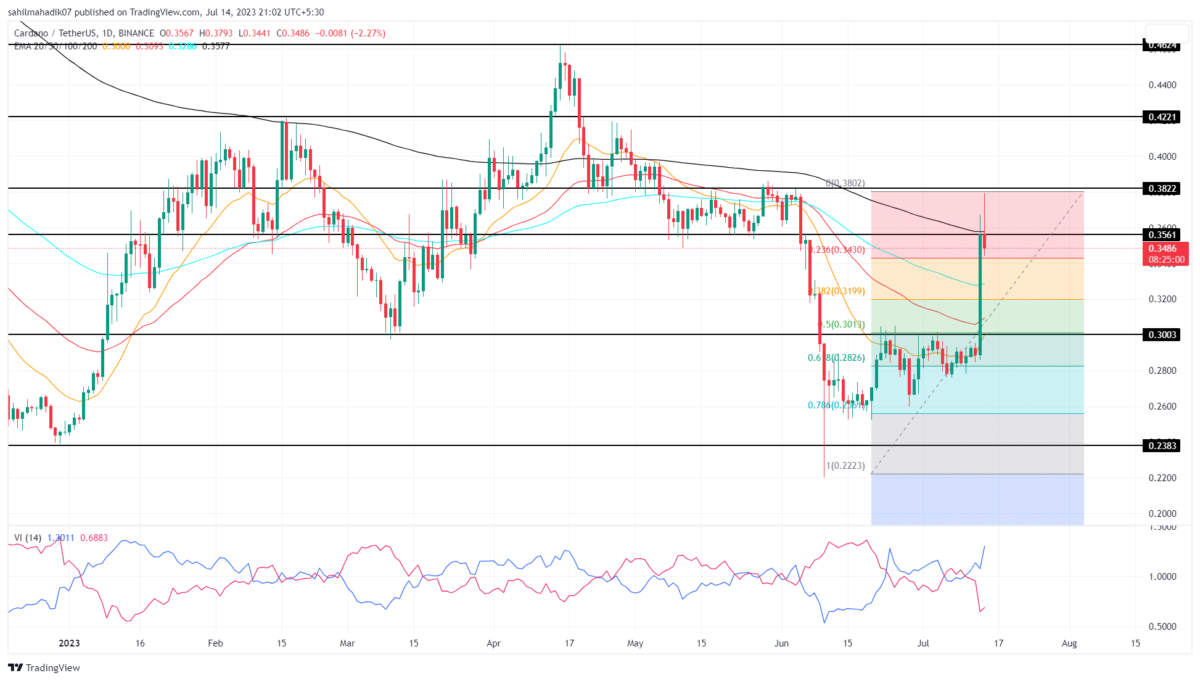
Shiba Inu Price Daily Chart:
- The $0.000000832 stands as strong resistance against traders
- The SHIB price is at risk of a potential pullback before the next leap
- The intraday trading volume of the Shiba Inu coin is $273.3 Million, showing a 111% gain.
 Source- Tradingview
Amid the recent upsurge in the crypto market, the Shiba Inu price jumped 14.11% from the $0.00000773 low offering an excellent follow-up to the trendline breakout of July 9th. This breakout signals a change in market sentiment from selling on rallies to buying on dips.
By the press time, the Shiba Inu price trades at $0.0000082 and faces supply pressure at $0.00000832 resistance. The rejection wick attached to the daily candle indicates the sellers defending the overhead resistance and could trigger a minor correction.
However, the possible reversal would be limited to the new coming support trendline. The coin holder can use this trendline for trailing stop loss as the dynamic support could bolster buyers to rechallenge the $0.00000832 resistance.
What if SHIB Price Reverted from $0.0000083?
If the bullish momentum in the market persists, a breakout above the $0.00000832 resistance could set the Shiba Inu price for a significant upswing. The post-breakout rally could surge the prices by 17% to hit $0.00000976, followed by $0.0000119.
- Average Directional Index: An uptick in the daily ADX slope projects the necessary strength in buyers to lead a bullish upswing.
- Bollinger Band: An upper band of the Bollinger Band indicator challenges up the SHIB price indicating the rising bullish momentum.

Why Trust CoinGape
CoinGape has covered the cryptocurrency industry since 2017, aiming to provide informative insights Read more…to our readers. Our journal analysts bring years of experience in market analysis and blockchain technology to ensure factual accuracy and balanced reporting. By following our Editorial Policy, our writers verify every source, fact-check each story, rely on reputable sources, and attribute quotes and media correctly. We also follow a rigorous Review Methodology when evaluating exchanges and tools. From emerging blockchain projects and coin launches to industry events and technical developments, we cover all facets of the digital asset space with unwavering commitment to timely, relevant information.