
Solana Price Path to $30; Double Bottom Pattern Sparks Bullish Upswing


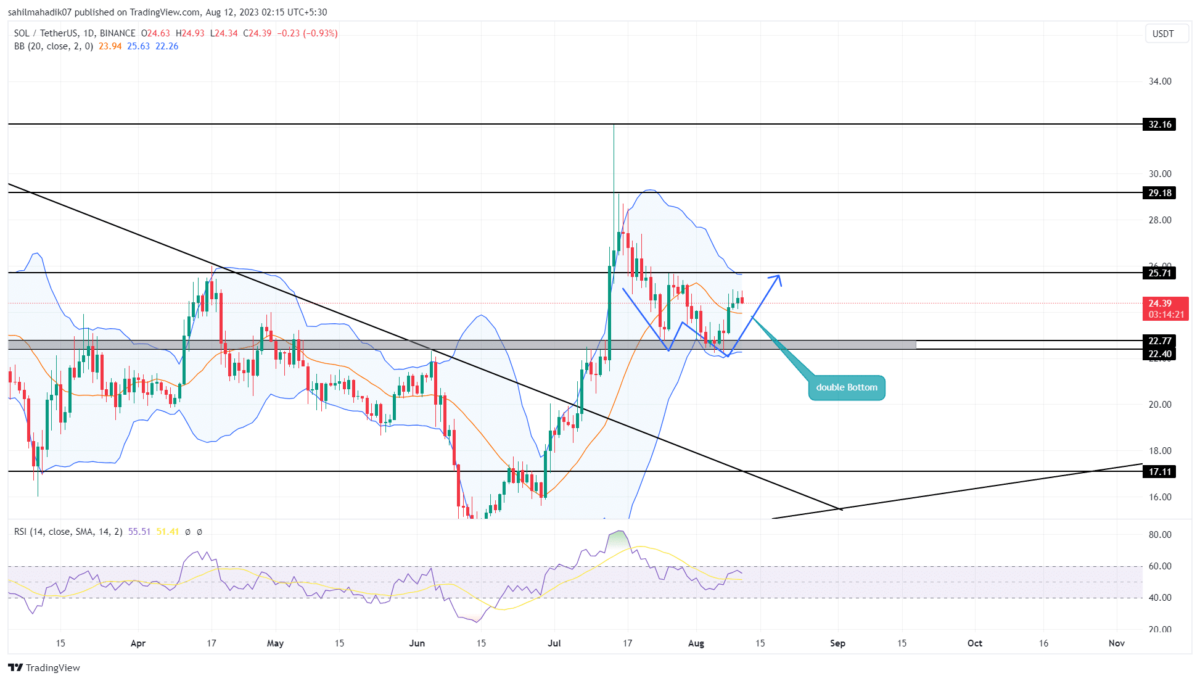
Taking a closer look at the daily time frame chart, the Solana price shows the formation of a double bottom pattern. This pattern often manifests itself at the market bottom, indicating a strong potential for an upward movement in prices. The double bottom consists of two successive troughs, both supported by a common price level – in this case, the $22.4 mark. Here are the potential targets if the chart pattern gets complete.
Also Read: Digital Asset Outflows Surge, Solana And XRP Lead Impressive Weekly Inflows
Solana Price Daily Chart
- The formation of a double bottom pattern indicates the market participants are taking heed of the accumulation potential and positioning themselves for potential gains
- The SOL price may witness high supply pressure at the $25.7 resistance
- The 24-hour trading volume on the Solana coin is $315.5 Million, indicating a 5.7% gain.
 Source-Tradingview
On August 7, the coin price experienced a notable reversal from the $22.4 support level. This reversal led to an impressive 9% surge, propelling the SOL price value to its current trading price of $24.45. This swift turnaround can be attributed to the bullish sentiment generated by the double-bottom pattern formation.
The current chart setup hints at a possible 5.8% price rise for SOL, bringing it closer to testing the resistance at $25.7. A successful breach here would indicate a bullish breakout, potentially triggering stronger buying activity and driving the price toward the $29 to $30 range, and followed by $32.
What if SOL Price Witness Higher Selling Pressure?
In the daily time frame chart, the Solana price has started to project higher upside wicks and short bodies, indicating the weakening of bullish momentum. If the altcoin approaches $25.7 and witnesses additional supply pressure, the price trend may turn sideways and create a narrow range for a few trading sessions. This consolidation may remove the weak and trigger a direction movement.
- Bowling band: The Bollinger Band indicator going flattish accentuates a sideways or no directional bias in the market right now.
- Relative Strength Index: The daily RSI slope potential rise above 50% indicates a suitable scenario for a bullish upswing.
Play 10,000+ Casino Games at BC Game with Ease
- Instant Deposits And Withdrawals
- Crypto Casino And Sports Betting
- Exclusive Bonuses And Rewards


Why Trust CoinGape
CoinGape has covered the cryptocurrency industry since 2017, aiming to provide informative insights Read more…to our readers. Our journal analysts bring years of experience in market analysis and blockchain technology to ensure factual accuracy and balanced reporting. By following our Editorial Policy, our writers verify every source, fact-check each story, rely on reputable sources, and attribute quotes and media correctly. We also follow a rigorous Review Methodology when evaluating exchanges and tools. From emerging blockchain projects and coin launches to industry events and technical developments, we cover all facets of the digital asset space with unwavering commitment to timely, relevant information.


- Breaking: IEA Cuts 2026 Global Oil Supply Forecast by 50% amid Middle East Tensions
- Is US Losing the War As Odds for US-Iran Conflict Lasting Until May Spike to 70%
- Crypto Stocks to Watch Today As Iran-US War Escalates- CRCL, MSTR, COIN, HOOD, MARA
- What US SEC-CFTC Harmonization Means for the Crypto Market & Regulation?
- Breaking: Trump Declares Victory in Iran War, Vows to ‘Finish the Job’
- Dogecoin Price Outlook If Elon Musk’s X Money Integrates Crypto- Is $0.2 Possible This Week?
- Will XRP Price Rally After Ripple’s Strategic Acquisition in Australia?
- Bitcoin Price At Risk of Losing $65k as Iran Warns of “Continuous Strikes” That May Push Oil to $200
- XRP Price Prediction as Goldman Sachs Becomes Biggest Holder of Ripple ETFs
- Circle (CRCL) Stock Price Prediction Ahead of CPI Data Release-Is 120 Next?
- Bitcoin Price Today: President Trump Signals Iran Conflict May End Soon As BTC Eyes $72k


