 Buy $GGs
Solana Price Prediction: Here’s Why $SOL Correction May Turn To 26% Rally


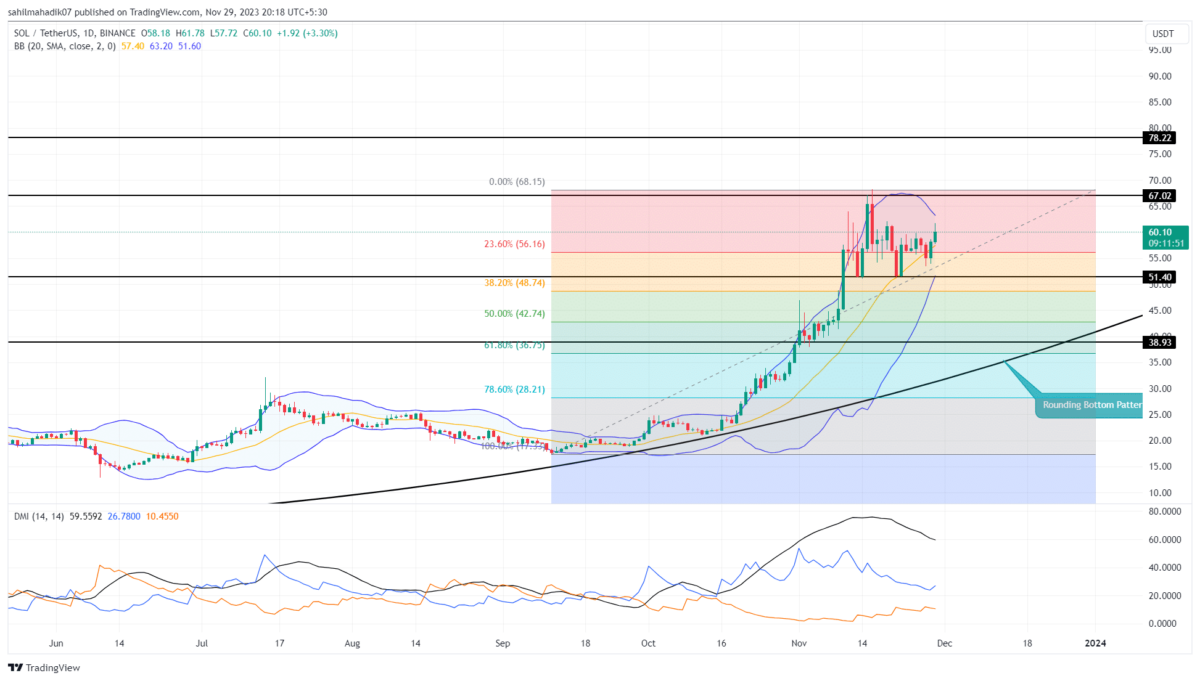
Solana Price Prediction: The ongoing correction in the Solana coin price has found suitable support at the $51.4 level. Over the past two weeks, the price rebounded twice from this level, signifying continued accumulation by buyers during market dips, a behavior often associated with strong market recovery. Within a fortnight, the coin price surged by 17.68% and currently trades at $60.5. Will this recovery surpass the $70 mark?
Also Read: Jito Launches JTO Token Airdrop for Its Solana DeFi Community
SOL Recovery to Extend 10%
- A 38.2% retracement could bolster buyers for a strong rebound
- The $51.4 level stands as strong support for buyers
- The 24-hour trading volume on the Solana coin is $2.37 Billion, indicating a 1.3% loss.

For almost three weeks, the Solana price has been trading sideways between the horizontal levels of $51.4 and $67. However, a sideways turn after a significant recovery is considered an opportunity for buyers to recuperate their exhausted bullish momentum.
This consolidation showcasing a retracement to the 38.2% Fibonacci retracement level, bolstered the same bullish thesis as it is considered a healthy retracement for the next leap. As Bitcoin surged above the crucial $38,000 resistance, the SOL recovery gained momentum, recording a 4.3% intraday growth, breaking past the psychological level of $60.
Continued buying could potentially drive the SOL price up by 11% to retest the last swing high of $67.3. Should it break this barrier, a 16% rally to reach $78.2 could ensue, contributing to the formation of a rounding bottom pattern.
This pattern suggests that the prevailing downtrend might have found its bottom, hinting at an expected sustainable recovery.
SOL vs BTC Performance

Over the last three months, the SOL price has showcased significant growth during the October-November rally, in contrast to a gradual ascent in Bitcoin price. While this rapid growth appears promising, risk-averse traders might panic during occasional corrections that extend to the 38.2% to 50% Fibonacci levels. Amid the ongoing correction, coin holders may consider marking the 50% Fibonacci level at $42.75 to manage their stop loss.
- Bollinger band: The downsloping upper boundary of the Bollinger band indicator could hinder the SOL recovery around the $64 mark.
- Directional Moving Index: The DI+(blue) and DI-(orange) slope maintaining a bullish crossover state reflects the overall market recovery intact.
Play 10,000+ Casino Games at BC Game with Ease
- Instant Deposits And Withdrawals
- Crypto Casino And Sports Betting
- Exclusive Bonuses And Rewards


Why Trust CoinGape
CoinGape has covered the cryptocurrency industry since 2017, aiming to provide informative insights Read more…to our readers. Our journal analysts bring years of experience in market analysis and blockchain technology to ensure factual accuracy and balanced reporting. By following our Editorial Policy, our writers verify every source, fact-check each story, rely on reputable sources, and attribute quotes and media correctly. We also follow a rigorous Review Methodology when evaluating exchanges and tools. From emerging blockchain projects and coin launches to industry events and technical developments, we cover all facets of the digital asset space with unwavering commitment to timely, relevant information.

Related Articles


- Breaking: U.S. PPI Inflation Rises To 2.9%, BTC Price Falls
- XRP News: Ripple-Backed Ctrl Alt Completes $280M in Diamond Tokenization on XRPL
- Bitwise CIO Calls Bitcoin Selloff ‘Classic Cycle,’ Dismisses Manipulation Rumors
- Cardone Capital Takes Real Estate On-Chain With $5B Tokenization Plan
- Senator Elizabeth Warren Targets Trump-Affiliated World Liberty Financial Over Bank Charter Bid
- Top 2 Price Predictions Ethereum and Solana Ahead of March 1 Clarity Act Stablecoin Deadline
- Pi Network Price Prediction Ahead of Protocol Upgrades Deadline on March 1
- XRP Price Outlook As Jane Street Lawsuit Sparks Shift in Morning Sell-Off Trend
- Dogecoin, Cardano, and Chainlink Price Prediction As Crypto Market Rebounds
- Will Solana Price Rally to $100 If Bitcoin Reclaims $72K?
- XRP Price Eye $2 Rebound as On-Chain Data Signals Massive Whale Accumulation


