 Buy $GGs
Solana Price Recovers 10% In Two Days; Time To Buy?


Solana’s price recovers from the reliable support zone of $30.46. Now, the price hovers near the critical resistance zone. The current market structure and the technical setup favor the bullish view.
As of writing SOL/USD is trading at $33.47, up 2.31% for the day. The ninth largest cryptocurrency by market cap holds the 24-hour trading volume at $1,058,262,250 with more than 6% gains according to CoinMarketCap data.
- Solana price extends the gains for the second straight day.
- Bull’s keep eye on $36.00 following the bullish formation on the daily chart.
- The price depreciated nearly 37% from the swing highs of $48.42.
Solana price turns positive
Solana price on the daily chart shaped a “Bullish Shark Harmonic” pattern. During a very optimistic Shark pattern, however, the second top is higher than the first one. To boost, it combines Fibonacci with Elliott’s waves theory, and a couple of new ratios like 127.20% retracement levels are used.
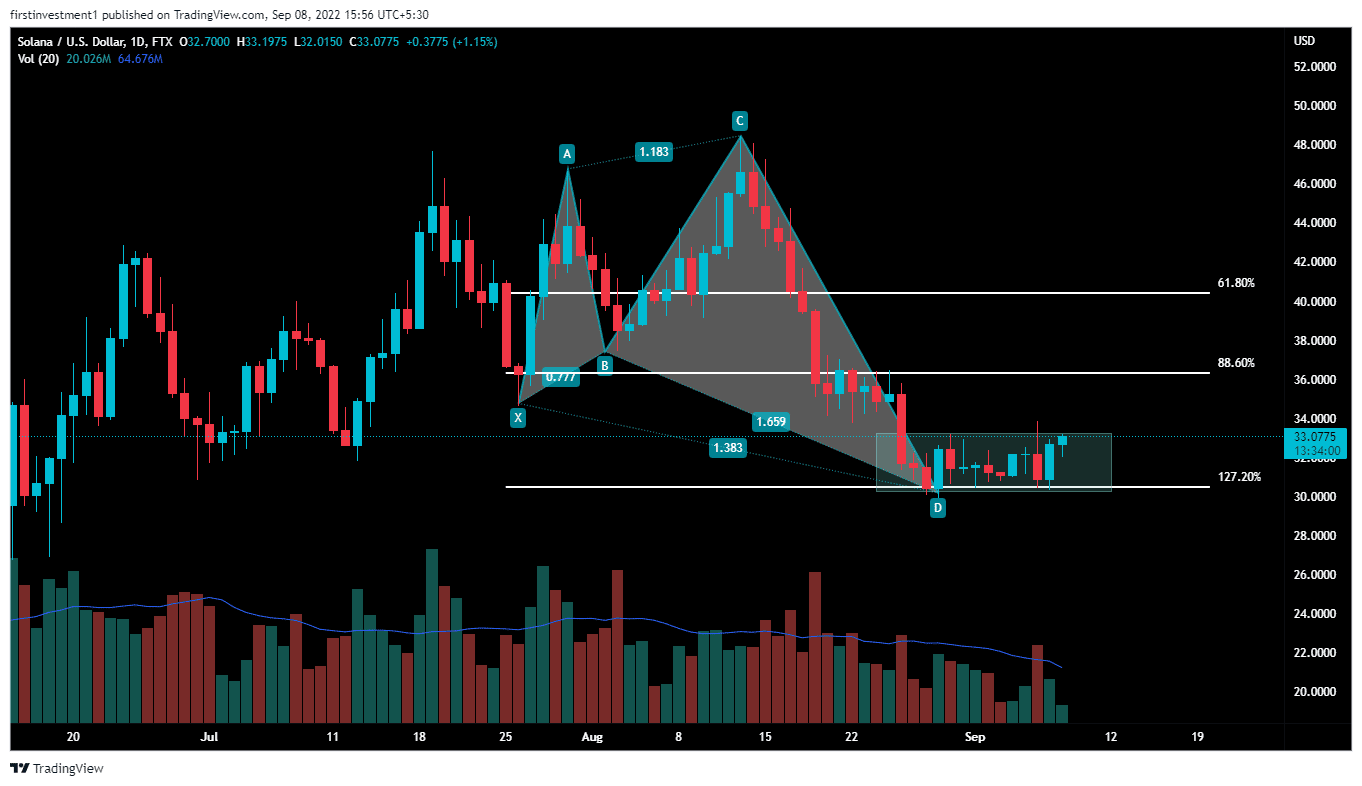
According to this pattern, if the price closes higher than its long consolidation zone resistance ($33.05), then we’ll expect an optimistic movement of up to ($36.50).
On the other hand, a shift in the bearish sentiment could trigger selling in the price. If that happens, the first downside target could be located at $31.80 followed by the low of August 28 at $30.05.
To conclude the argument, the price remains pessimistic and contains a possibility to travel down even additional in the future in the longer term to its recent swing low. Provided if the price is not ready to close above higher than the mentioned level in the short-term.
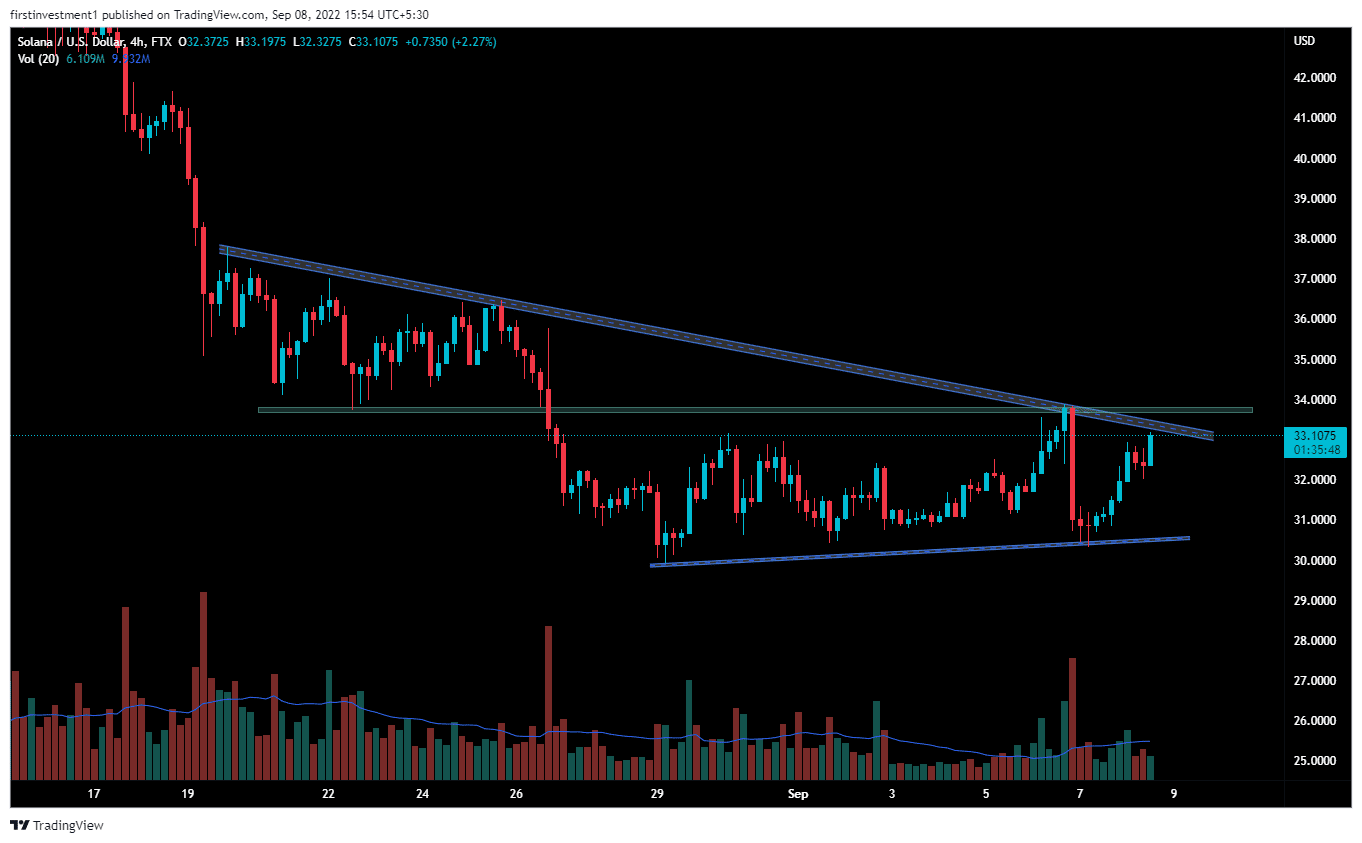
SOL on the four-hourly chart formed a “Symmetrical Triangle” pattern. The Symmetrical Triangle is a volatility contraction pattern. This means volatility in the market is shrinking and a sign the market is likely to break out, out soon. There is a higher probability of price giving breakout from its zone on the higher side, breaking out the resistance of ($33.85)
According to this pattern, a breakout above $33.85, will take Solana’s price to the highs of August 25 ( $36.42) followed by the psychological $40.0 level.
The nearest support is the previous swing low ($32.00), whereas the nearest resistance could be found at ($33.85). There is a higher probability of the price breaking the resistance level. “Breakout strategy” is the best course of action we can go with.
Also read: Bitcoin Price Surge: Is The Bottom In Or Another Bull Trap?
On the opposite hand, a prospect below the $30.40 level may invalidate the bullish outlook. And also the price could drop to $29.00.
Solana is slightly bullish on all time frames. Above $33.85 closing on the hourly timeframe, we will place a trade on the buying aspect.
Play 10,000+ Casino Games at BC Game with Ease
- Instant Deposits And Withdrawals
- Crypto Casino And Sports Betting
- Exclusive Bonuses And Rewards


Why Trust CoinGape
CoinGape has covered the cryptocurrency industry since 2017, aiming to provide informative insights Read more…to our readers. Our journal analysts bring years of experience in market analysis and blockchain technology to ensure factual accuracy and balanced reporting. By following our Editorial Policy, our writers verify every source, fact-check each story, rely on reputable sources, and attribute quotes and media correctly. We also follow a rigorous Review Methodology when evaluating exchanges and tools. From emerging blockchain projects and coin launches to industry events and technical developments, we cover all facets of the digital asset space with unwavering commitment to timely, relevant information.

Related Articles


- XRP News: Ripple Prime to Move Post-Trade Activity to XRPL via NSCC Link
- Fed Rate Cut at Risk: Janet Yellen Flags Inflation Concerns Amid US-Iran War
- Senate Eyes CLARITY Act Markup This Month as Banks, Crypto Continue Stablecoin Yield Talks
- Why XRP Price Rising Today? (2 March)
- Breaking: Bitcoin Price Rises to $70k as Gold Crashes Amid U.S.-Iran Conflict
- Top 5 Historical Reasons Dogecoin Price Is Not Rising
- Pi Coin Price Prediction for March 2026 Amid Network Upgrade, KYC Boost, Rewards Distribution
- Gold Price Nears ATH; Silver Eyes $100 Breakout on Us- Iran War
- Bitcoin And XRP Price As US Kills Iran Supreme Leader- Is A Crypto Crash Ahead?
- Gold Price Prediction 2026: Analysts Expect Gold to Reach $6,300 This Year
- Circle (CRCL) Stock Price Prediction as Today is the CLARITY Act Deadline


