 Buy $GGs
SUI Price Prediction- Will Robinhood Listing Fuel a Breakout To $5.5?


Highlights
- SUI price consolidates in an ascending triangle with resistance at $4.50.
- Robinhood listing expands access to millions of U.S. retail investors.
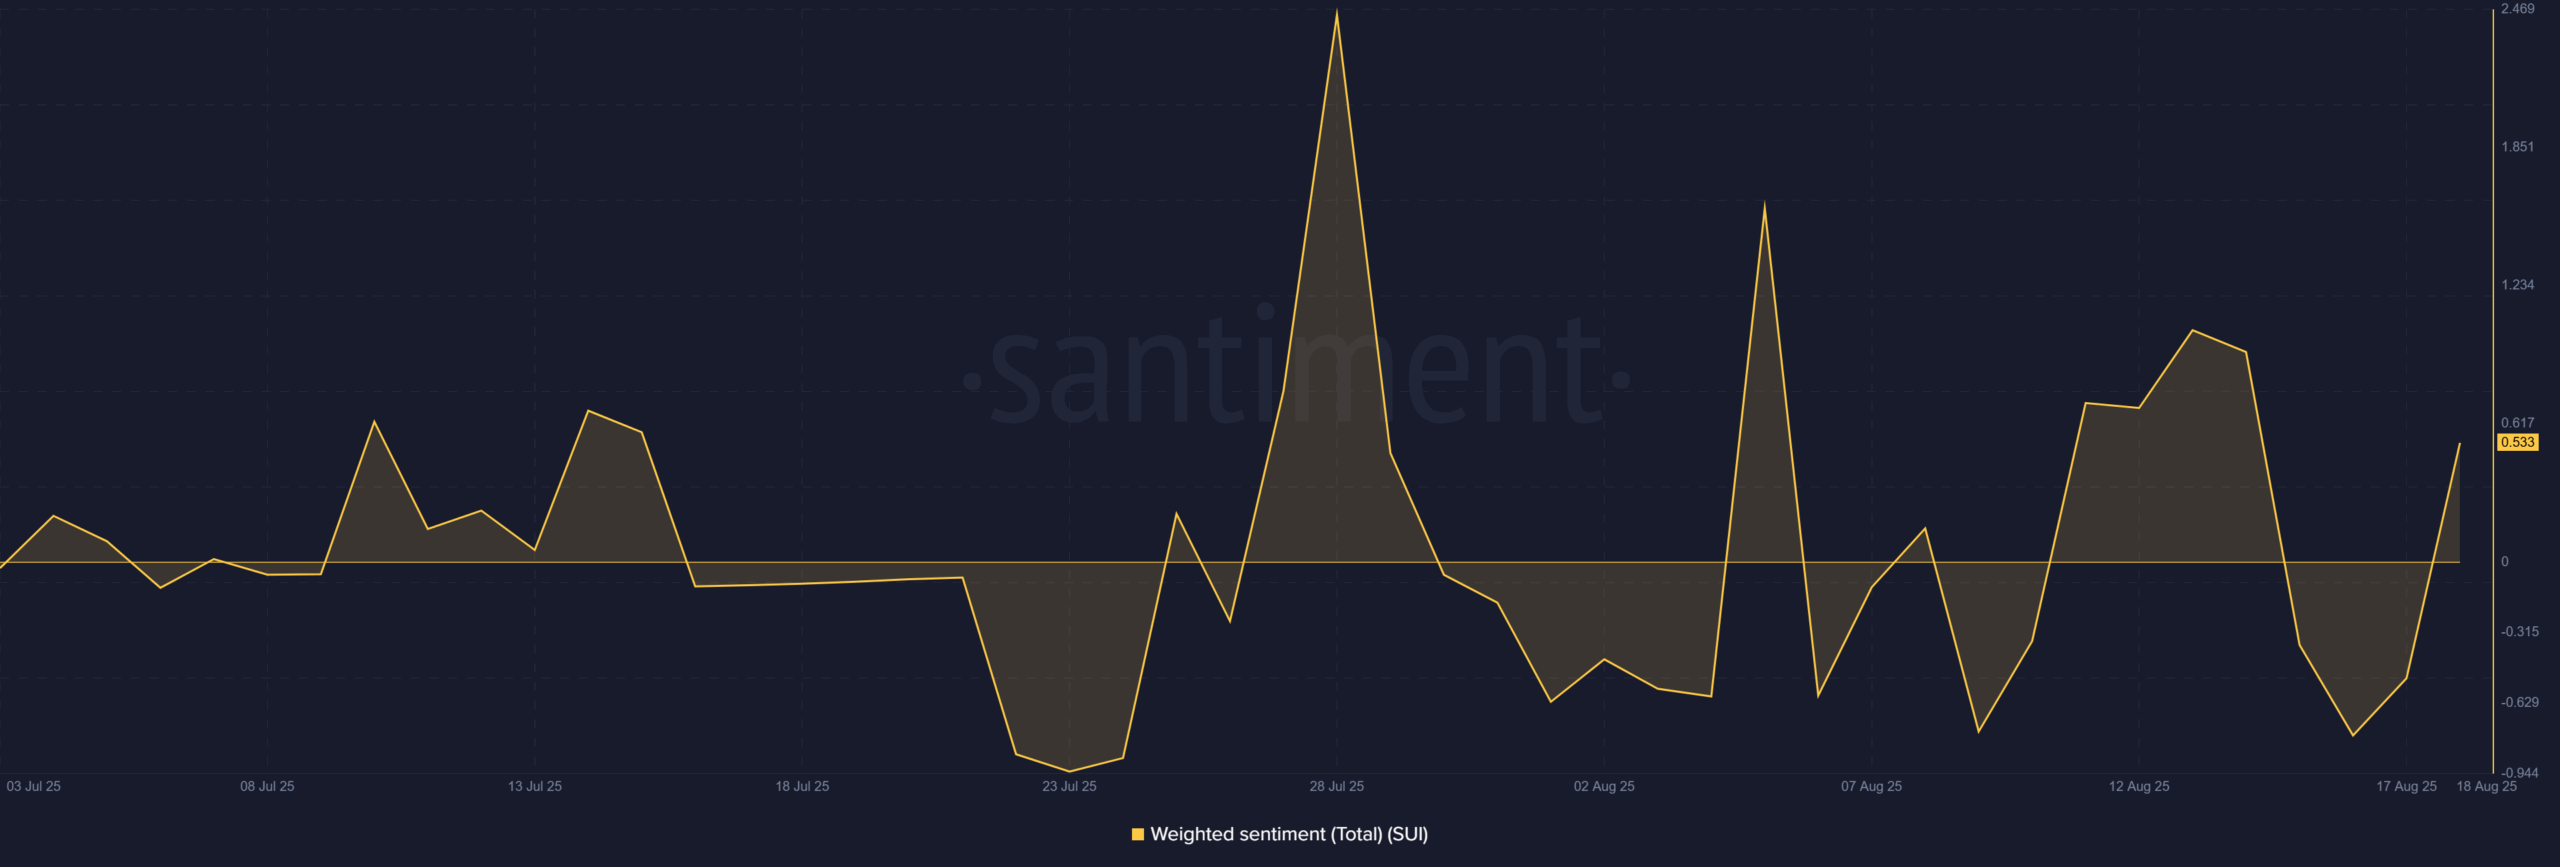
- Weighted sentiment rebounds to +0.533, signaling renewed market optimism.
At press time, SUI price saw a decrease of 3.09% to $3.49 in 24 hours, testing the ascending trendline support. Regardless of the retracement, the price structure is bullish and a breakout pattern is still in force. The most recent Robinhood listing could open up more demand, and sentiment indicators are showing increasing optimism.
Ascending Triangle Formation Sets SUI Price on a Bullish Course
The SUI price remains in a clear ascending triangle pattern, with a rising support and a flat resistance band between $4.46 and $4.50. This trend, which has been in place since June, shows great accumulation at higher lows with numerous rejections at the ceiling.
The price is trading above the key trendline at around $3.49, indicating that buyers are still defending the bullish structure. Breaking above $4.50 may lead to a steep up-move of 57.52% to the target of $5.5.
Conversely, a breakdown below $3.40 would nullify this bullish setup. At the moment, the structure holds and the long term SUI price outlook depends on its performance at $4.50.

The 14-day Money Flow Index (MFI) is at 48.75, which is in the neutral range. This level implies an equilibrium between inflows and outflows, and there is much space to a bullish blow in case buyers step in.
In case the MFI exceeds 60 and breaks out, it would support the inflow of new capital. Furthermore, the previous bounce in the indicator off of sub-40 levels indicates a decline in selling pressure over the recent days.
The shift along with the technical compression implies a possibility of energy accumulation under the surface. Should bulls reclaim resistance, this accumulation period might blow up into a full breakout. Therefore, the SUI price is technically supported and awaits a catalyst to unlock upside.
Robinhood Listing and Sentiment Shift Strengthen the Bullish Outlook
The launch of SUI on Robinhood, on August 19, will be a major step toward retail access. The new listing enables millions of users in the U.S. to instantly trade SUI using the Robinhood app, making it easier to onboard and eliminate friction to retail investors.
This listing is crucial, as it comes at a time when a bullish ascending triangle pattern is being formed on the SUI price chart. It adds accessibility and narrative fuel, two of the most important driving factors that may underpin an upside breakout.
Besides the listing, the weighted sentiment data provided by Santiment shows that the crowd psychology has changed. The metric, which had plunged into negative territory in the middle of August, has now recovered to a +0.533.
This indicates that investors are feeling optimistic once again. Such sentiment spikes can be followed by price rallies when supported by positive structural backdrops.
With both chart dynamics and on-chain mood aligned, the SUI price could be primed for its next major move, further supported by ETF filings from Canary and 21Shares that highlight growing institutional interest.
In summary, there is no doubt that the signals are all pointing to a breakout. The structure of the ascending triangle is still in place, sentiment is on the upside, and the listing of Robinhood provides a new surge of demand. A clean flip above $4.50 would probably drive the SUI price to the $5.5 target. Therefore, SUI is on the verge of a bullish breakout.
Play 10,000+ Casino Games at BC Game with Ease
- Instant Deposits And Withdrawals
- Crypto Casino And Sports Betting
- Exclusive Bonuses And Rewards

Frequently Asked Questions (FAQs)
1. What chart pattern is forming on SUI?
2. How does the Robinhood listing impact SUI?
3. What role does sentiment play in SUI’s outlook?

Why Trust CoinGape
CoinGape has covered the cryptocurrency industry since 2017, aiming to provide informative insights Read more…to our readers. Our journal analysts bring years of experience in market analysis and blockchain technology to ensure factual accuracy and balanced reporting. By following our Editorial Policy, our writers verify every source, fact-check each story, rely on reputable sources, and attribute quotes and media correctly. We also follow a rigorous Review Methodology when evaluating exchanges and tools. From emerging blockchain projects and coin launches to industry events and technical developments, we cover all facets of the digital asset space with unwavering commitment to timely, relevant information.
Sui
24 Hours volume
$517.51M
Market Cap
$3.78B
Max Supply
10B

Related Articles


- XRP News: Institutional Use Case Expands as Doppler Finance Integrates WXRP for Multi-Chain Access
- Trump Tariffs: Bitcoin Faces Fresh Headwinds as 15% Global Tariffs Begin This Week Amid Iran War
- Bitget Unveils ‘Crypto Anti-Bias Pledge’ To Support Women’s Inclusion In Crypto
- U.S.-Iran War: Crypto Market Rebounds as Iran Reportedly Reaches Out To U.S. To End Conflict
- Bitget Rolls Out Group-Based Maker Rates to Boost Liquidity Across Spot and Futures
- COIN Stock Analysis as Bitcoin Retests $72k Ahead of February NFP Data
- Robinhood Stock Price Prediction As Cathie Wood Buys $12M Dip in Bold ARK Move
- Bitcoin Price At Risk? Professor Who Predicted US-Iran War Says America Could Lose
- Gold Price Prediction March 2026: Rally, Crash, or Record Highs?
- RIOT Stock Prediction as Needham, Piper Sandler Slash Target After Earnings
- Cardano Price Outlook As Charles Hoskinson Warns Over CLARITY Act


