Will Bitcoin Price Hold $29600 Support Amid Current Market Sell-off?


While the bullish hype built up from the application of various US-based companies for spot Bitcoin ETF faded, the crypto market witnessed a downturn this week. As a result, the largest cryptocurrency Bitcoin turned down from the multiple-month resistance zone of $31400-31300. The bearish reversal has plunged the coin price to 4.5% to retest the demand zone at $29640. Will the BTC price continue its downward projection from here?
Also Read: Arthur Hayes Sees Bitcoin as Currency for AI, Sets New Price Target
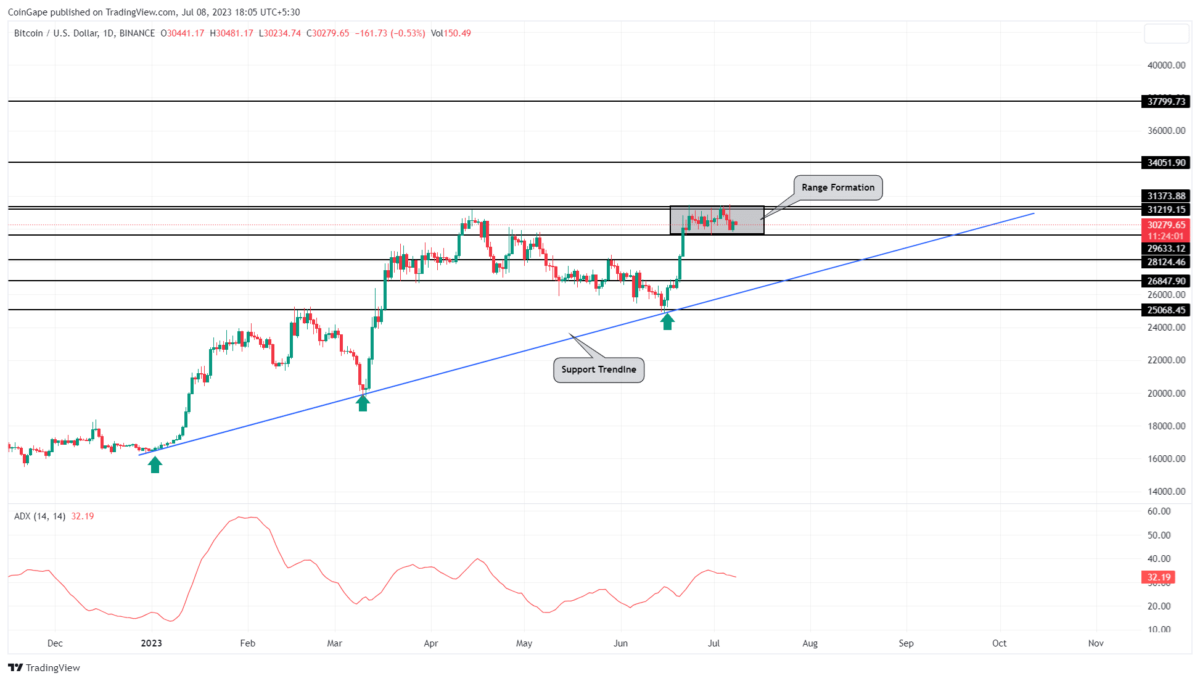
Bitcoin Price Daily Chart
- The range formation projects a no-trading zone between $31300 and $29640 horizontal level.
- The $28130 level stands as a strong support zone for Bitcoin buyers
- The intraday trading volume in Bitcoin is $10.5 Billion, indicating a 45% loss.
 Source-Tradingview
Over the past two weeks, the Bitcoin price continues to wobble in a tight range stretching from $31300 to $29640. On July 7th, the coin price bounced from the range’s support level indicating the buyers continue to defend higher prices and thus it could prolong the sideways action.
If the bullish momentum persists, the coin holders may witness a 2.7% rise to rechallenge overhead resistance. Therefore, the Bitcoin price needs a suitable breakout from this range to determine the potential trend in the near future.
As the current consolidation is considered a temporary break from a high-momentum rally, the buyers will more likely continue the upward trend once the bullish momentum recuperates. A breakout above $31300 could extend the bull run to $33000, followed by $34850 and $37470.
What if Bitcoin Price Breaks $29640 Support?
The Bitcoin price may enter a longer correction mode if the sellers break below the $29640 support. This breakdown could tumble the prices by 5% and reach the combined support of $28100 and 50% Fibonacci retracement support. The coin holders can maintain their bullish sentiment until the aforementioned horizontal support and a long-coming trendline are intact.
- Average Directional Index: A slight downtick in the daily ADX slope reflects the buyers still holding sufficient strength.
- Exponential Moving Average: The Bitcoin price rebounded from the 20-day EMA indicating the market sentiment is still aggressively bullish.

Why Trust CoinGape
CoinGape has covered the cryptocurrency industry since 2017, aiming to provide informative insights Read more…to our readers. Our journal analysts bring years of experience in market analysis and blockchain technology to ensure factual accuracy and balanced reporting. By following our Editorial Policy, our writers verify every source, fact-check each story, rely on reputable sources, and attribute quotes and media correctly. We also follow a rigorous Review Methodology when evaluating exchanges and tools. From emerging blockchain projects and coin launches to industry events and technical developments, we cover all facets of the digital asset space with unwavering commitment to timely, relevant information.