 Claim Card
Will Shiba Inu Price Recover to $0.00001? Key Support levels to Watch


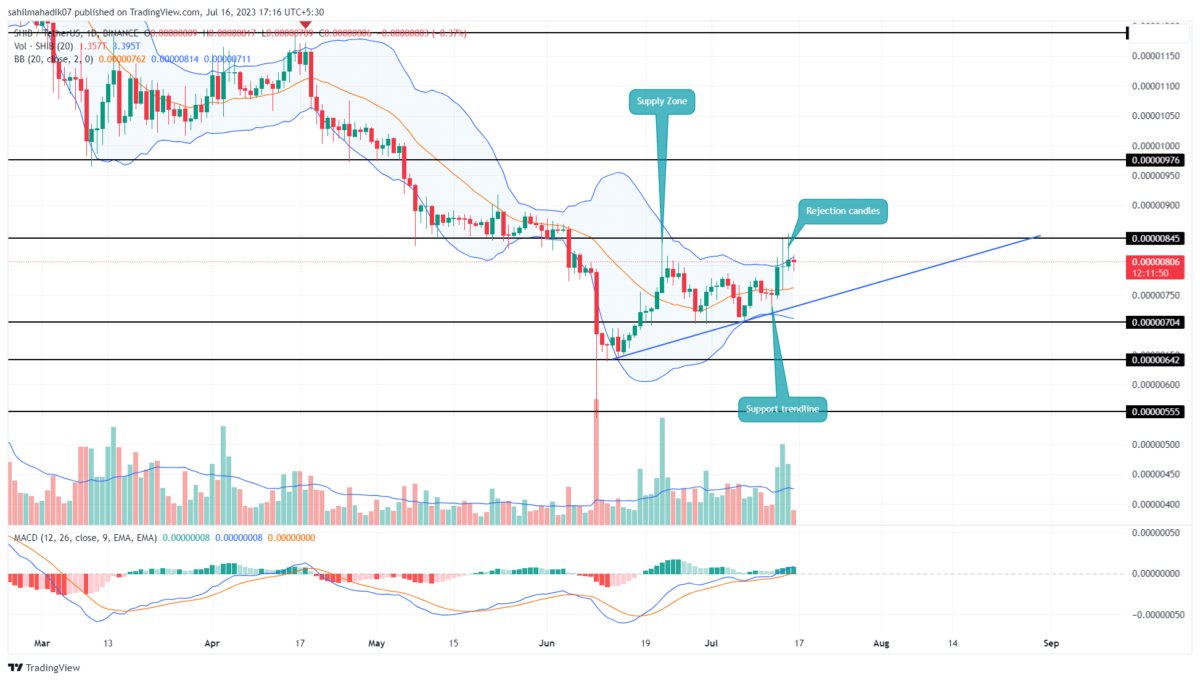
Amid the recent recovery sentiment in the market and the development of Shiba Inu’s layer-2 (L2) blockchain network Shibarium, the SHIB price has showcased impressive recovery in the last 4 weeks. From the June 15th low of $0.00000642, this popular memeecoin surged 32% to hit the $0.00000845 resistance. Will this recovery continue or is it time for correction?
Also Read: Shiba Inu Gets Ready to Compete With Polygon And Arbitrum With Shibarium Layer 2
Shiba Inu Price Daily Chart:
- A support trendline governs the short-term recovery in Shiba Inu price
- The higher price rejection candle at $0.00000845 reflect a high supply zone
- The intraday trading volume of the Shiba Inu coin is $146.5 Million, showing a 54% loss.
 Source- Tradingview
By the press time, the Shiba Inu price traded at $0.000008 and witnessed supply pressure at $0.00000845 resistance. The daily candles with long-wick rejection indicate the seller’s aggressive nature at this barrier and the possibility of a bearish reversal.
The buyers’ failure to reclaim this barrier could trigger a bearish reversal and plunge the SHIB price 5-6% down and hit a new support trendline. This trendline is carrying this ongoing recovery by offering dynamic support. With each retest to ascending trendline, the buyers get an opportunity to replenish bullish momentum and give another attempt to strike back $0.00000845.
A potential breakout above the aforementioned resistance with daily candle closing will boost underlying buying pressure and surge the memecoin price 15.5% higher to reach $0.00000976-$0.00001.
Can SHIB Price Plunge to $0.0000064?
The SHIB holders riding the current recovery can use the support trendline for trailing stop loss. In case the supply pressure at $0.00000845 overthrows buyers, a breakdown below the rising trendline will undermine the bullish thesis. This crackdown will prolong the prevailing downtrend and plunge the price back to $0.0000064 support.
- Moving Average Convergence Divergence: An uptick in MACD(blue) and signal(orange) indicator of the weekly chart indicates early signs of a trend change
- Bollinger Band: The SHIB price challenging the upper band of the Bollinger Band indicator suggests high momentum rally.

Why Trust CoinGape
CoinGape has covered the cryptocurrency industry since 2017, aiming to provide informative insights Read more…to our readers. Our journal analysts bring years of experience in market analysis and blockchain technology to ensure factual accuracy and balanced reporting. By following our Editorial Policy, our writers verify every source, fact-check each story, rely on reputable sources, and attribute quotes and media correctly. We also follow a rigorous Review Methodology when evaluating exchanges and tools. From emerging blockchain projects and coin launches to industry events and technical developments, we cover all facets of the digital asset space with unwavering commitment to timely, relevant information.

Related Articles


- Expert Predicts Deeper Bitcoin Decline as JPMorgan CEO Warns of Similarities to the 2008 Financial Crisis
- Trump Won’t Pardon FTX’s Sam Bankman-Fried (SBF), White House Says
- Third Spot SUI ETF Goes Live as 21Shares Fund Launches on Nasdaq
- Mark Zuckerberg’s Meta Reportedly Eyes Stablecoin Integration This Year Amid Regulatory Clarity
- Coinbase Rivals Robinhood As It Rolls Out Stocks, ETFs Trading In ‘Everything Exchange’ Push
- Cardano Price Signals Rebound as Whales Accumulate 819M ADA
- Sui Price Eyes Recovery as Third Spot SUI ETF Debuts on Nasdaq
- Pi Network Price Eyes a 30% Jump as Migrations Jumps to 16M
- Will Ethereum Price Dip to $1,500 as Vitalik Buterin Continues Selling ETH?
- XRP Price Outlook as Clarity Act Passage Odds Plunge to 53%
- COIN Stock Risks Crashing to $100 as Odds of US Striking Iran Jump


