XRP Price Analysis: XRP Bulls Must Defend This Price Level To Avoid Major Correction


The ongoing correction phase in XRP price from suitable support at the $0.6 level. Amid the three weeks downfall, the altcoin registered a 36.5% loss as the price dropped from the July 13th high of $0.938 to the $0.596 low. The aforementioned support aligned with the 50% Fibonacci retracement level creates a strong footing for buyers to replenish bullish momentum. Should you enter this dip?
XRP News: Gemini Relists XRP Token, Opens Support For XRP Ledger (XRPL)
XRP Chart: Key Points
- The XRP buyers can witness strong demand pressure from $0.6 support
- A bullish breakout from the overhead resistance of $0.665 could bolster buyers for 10.8
- The intraday trading volume in the XRP is $504 Billion, indicating a 22.12% loss.
 Source: Tradingview
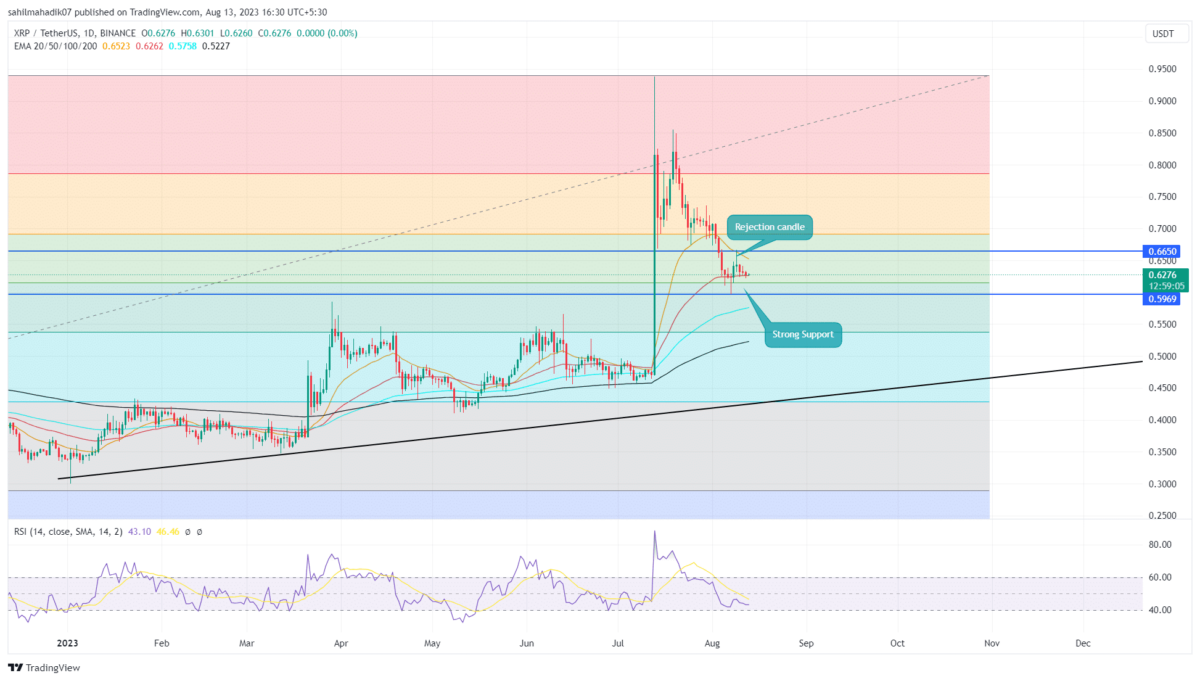
On August 7th, the XRP price bounced back from the $0.6 support as an attempt from buyers to reclaim higher ground. However, after a short jump of 11.4%, the coin price faced immediate resistance at $0.665.
The rejection candle at this barrier indicates the traders still follow the sentiment of selling on bounces, observed in an established downtrend. The bearish reversal undermined the 6.55% gain of the prior upswing as the XRP price currently trades at $0.627.
The declined price is expected to rechallenge the $0.6 support combined with 50% FIB. In theory, a correction to 0.5% FIB is healthy for a long-term trend whereas a downfall below starts to reflect weakness in bullish momentum.
Thus, a breakdown below $0.6 could threaten the XRP holders for a major correction.
[converter id=”xrp-xrp” url=”https://coingape.com/price/converter/xrp-to-usd/?amount=1″]
XRP Buyers Need to Watch Support Level
If the falling XRP price witnesses another surge of buying pressure to $0.6, it would indicate the buyers are accumulating a discounted price. This demand pressure could trigger a sideways action for a few trading days, offering buyers an opportunity to regain strength. Thus a potential breakout from the $0.665 barrier would give the first signal for recovery.
- Exponential Moving Average: The altcoin price trading above 100-and-200-day EMA indicates the overall trend remains bullish.
- Relative Strength Index: The RSI slope of 40% reflects the buyers having enough momentum to carry a bullish reversal.

Why Trust CoinGape
CoinGape has covered the cryptocurrency industry since 2017, aiming to provide informative insights Read more…to our readers. Our journal analysts bring years of experience in market analysis and blockchain technology to ensure factual accuracy and balanced reporting. By following our Editorial Policy, our writers verify every source, fact-check each story, rely on reputable sources, and attribute quotes and media correctly. We also follow a rigorous Review Methodology when evaluating exchanges and tools. From emerging blockchain projects and coin launches to industry events and technical developments, we cover all facets of the digital asset space with unwavering commitment to timely, relevant information.

Related Articles


- Michael Saylor Says Quantum Risk To Bitcoin Is a Decade Away, Describes it as ‘FUD’
- White House Proposes Stablecoin Rewards Compromise as CLARITY Act Odds Drop to 44%
- Trump’s Board Of Peace Eyes Dollar-Backed Stablecoin For Gaza Rebuild
- Trump’s World Liberty Financial Flags ‘Coordinated Attack’ as USD1 Stablecoin Briefly Depegs
- Trump Tariffs: U.S. Threatens Higher Tariffs After Supreme Court Ruling, BTC Price Falls
- COIN Stock Risks Crashing to $100 as Odds of US Striking Iran Jump
- MSTR Stock Price Predictions As Michael Saylor’s Strategy Makes 100th BTC Purchase
- Top 3 Meme Coins Price Prediction As BTC Crashes Below $67k
- Top 4 Reasons Why Bitcoin Price Will Crash to $60k This Week
- COIN Stock Price Prediction: Will Coinbase Crash or Rally in Feb 2026?
- Shiba Inu Price Feb 2026: Will SHIB Rise Soon?


