
Meme-coins have slid off the charts, what’s next? Dogecoin and Shiba Inu Price Analysis: 13th December


The cryptocurrency market had witnessed quite a fall in the month of December, ever since that flash crash, recovery has been slow for most crypto-coins. Although, this year has been a year for meme-coins, with Dogecoin stealing the show and Elon Musk supporting the coin, all the while causing multiple rallies one after the other. In regards to the same, many other meme-coins such as Shiba Inu and SafeMoon trailed behind Dogecoin in anticipation of finding the same kind of footing in the market.
The success of meme coins had propelled certain coins such as Dogecoin to find themselves among the top 10 coins. Often because the intrinsic value of such meme coins are questioned, amidst the volatility, of late the appeal of such coins have started to dampen. Dogecoin also recently dropped out of the top 10 coins.
Here’s the recent price analysis of Dogecoin and Shiba Inu.
DOGE/USD Four-Hour Chart
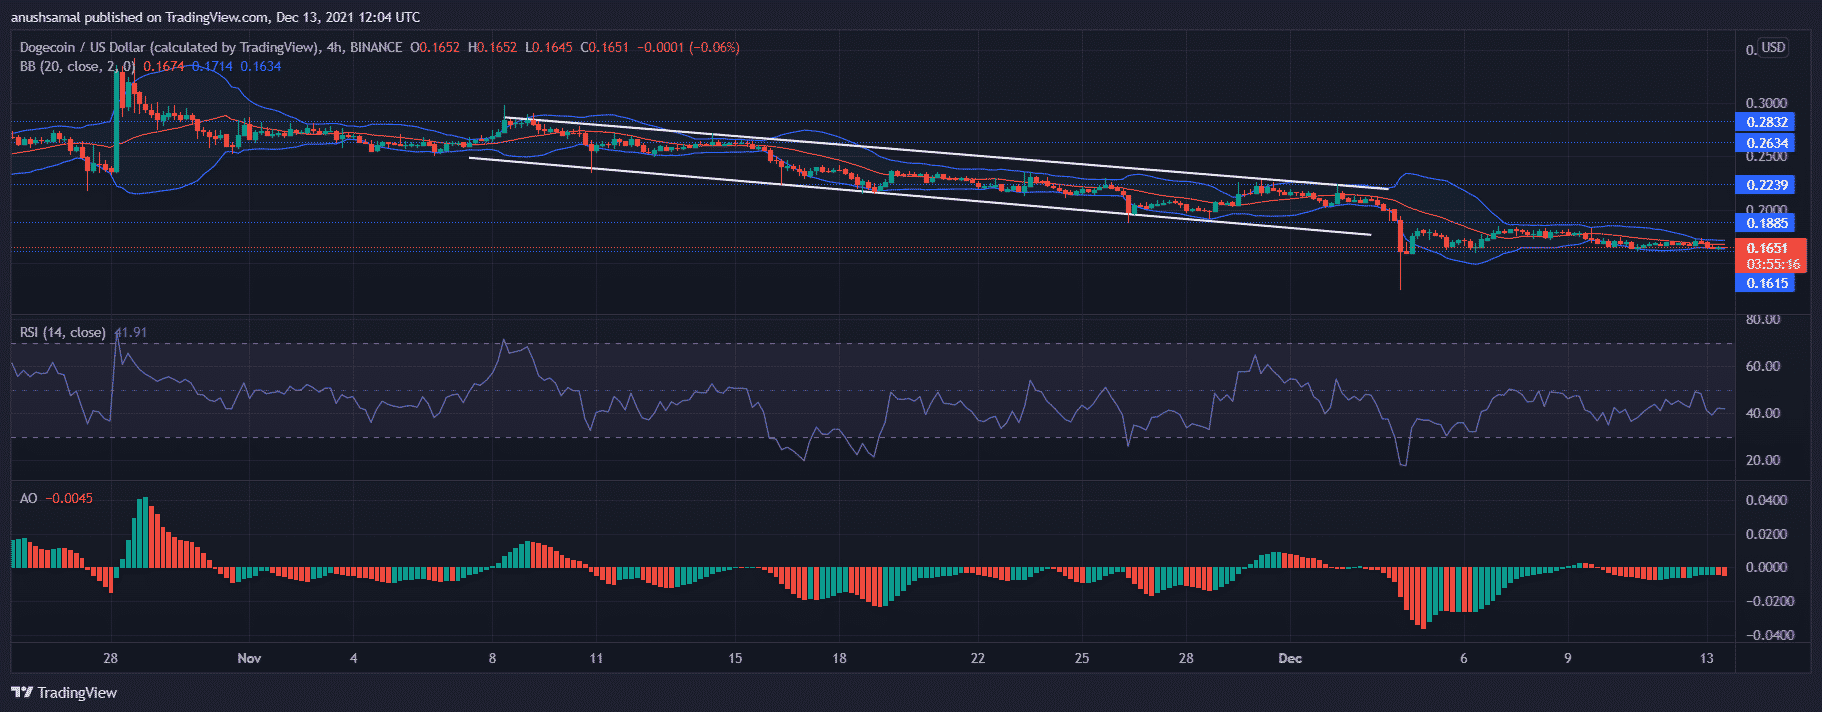
At press time, Dogecoin was trading at $0.165 and was down by 7.8% over the last 24 hours. Over the last few weeks, Dogecoin’s prices have formed a descending channel confirming that the coin had been on a downtrend. The immediate resistance for the coin stood at $0.188, for Dogecoin to log in successful recovery, it has to trade above the aforementioned level. Other resistance levels stood at $0.223 and then at $0.263.
Bollinger Bands remained heavily constricted, a reading that also points towards a potential breakout. In case of further downward price action, the nearest support line stood at $0.161. Other technicals also indicated bearish price action. The Relative Strength Index was also in the negative territory, parked below the half-line.
Awesome Oscillator depicted red histograms as prices have fallen ever since the last couple of weeks.
SHIB/USD Four-Hour Chart
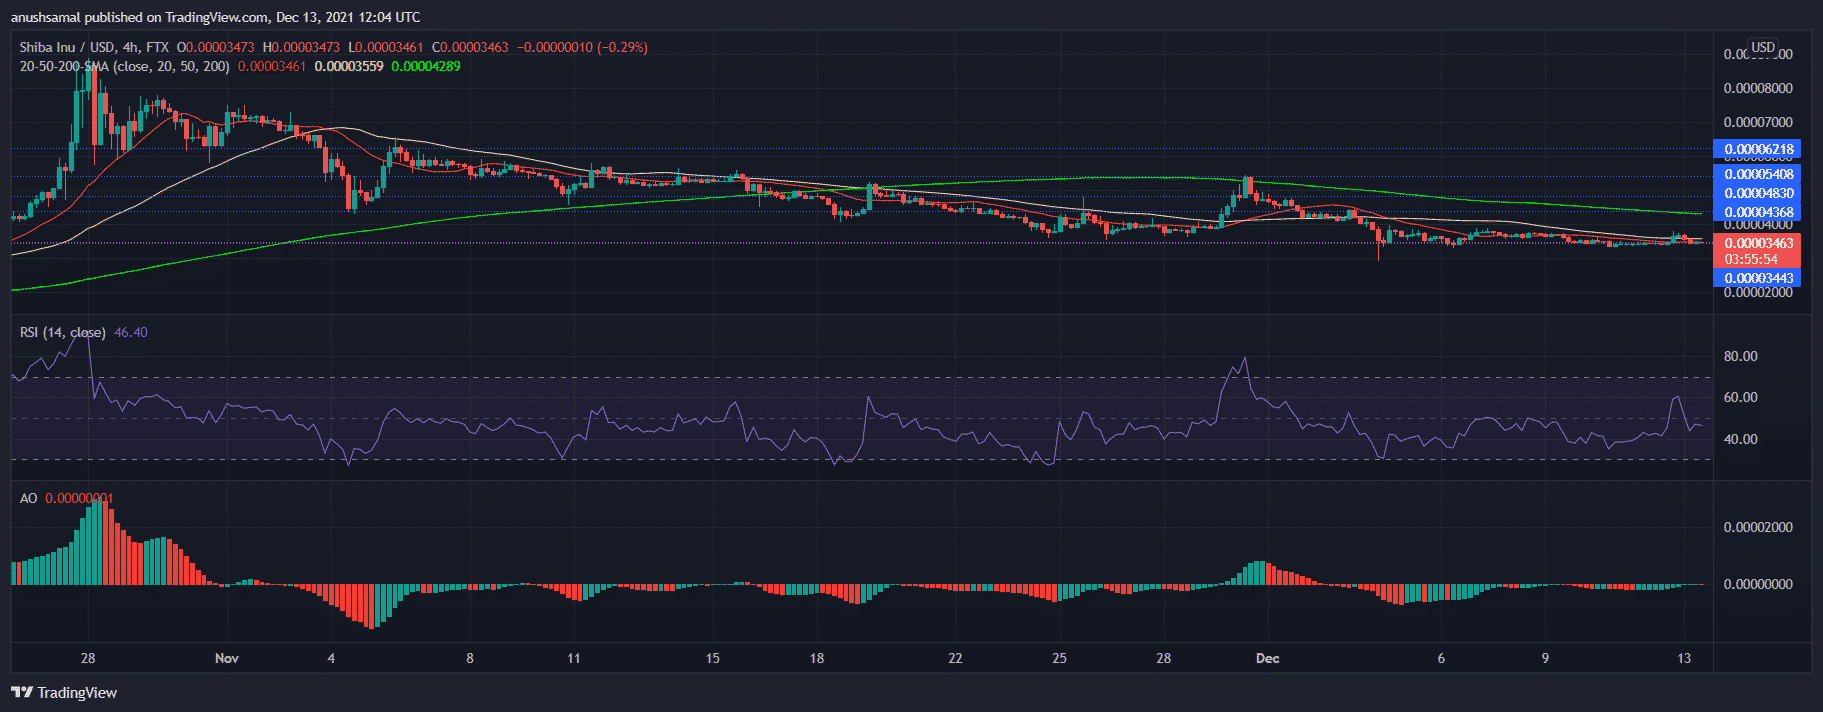
Shiba Inu’s price action has remained consolidated between the $0.000034 and $0.000043 over the past week. The technical outlook was also bearish considering how Shiba Inu performed in the last few days. At the time of writing, the coin was trading for $0.000034 and prices were seen below the 20-SMA line which meant that the sellers dominated the price momentum in the market.
Shiba Inu’s support lines stood at $0.000048 and then at $0.000054. The Relative Strength Index was in the bearish zone as the selling pressure remained while buyers exited the market Awesome Oscillator flashed a small red histogram as a consequence of decreasing prices over the past few days.
For Shiba Inu to secure considerable recovery, the coin has to trade the $0.000048 mark as that price level has previously acted as a propelling point for the coin. This could be possible if buyers stepped in over the upcoming trading sessions.
Play 10,000+ Casino Games at BC Game with Ease
- Instant Deposits And Withdrawals
- Crypto Casino And Sports Betting
- Exclusive Bonuses And Rewards


Why Trust CoinGape
CoinGape has covered the cryptocurrency industry since 2017, aiming to provide informative insights Read more… to our readers. Our journal analysts bring years of experience in market analysis and blockchain technology to ensure factual accuracy and balanced reporting. By following our Editorial Policy, our writers verify every source, fact-check each story, rely on reputable sources, and attribute quotes and media correctly. We also follow a rigorous Review Methodology when evaluating exchanges and tools. From emerging blockchain projects and coin launches to industry events and technical developments, we cover all facets of the digital asset space with unwavering commitment to timely, relevant information.

Delivered every day.
- Insights that move markets
- 100,000 active subscribers


- Breaking: U.S. Prepares for Potential Peace Talks in Iran War as Trump Mulls ‘Winding Down’ Military Efforts
- Crypto Market Recovers as Expert Warns U.S. Easing of Iran Sanctions Won’t Stabilize Oil Prices
- CLARITY Act May Still Delay Despite Stablecoin Yield Deal, Galaxy’s Alex Thorn Warns
- MSTR, COIN, HOOD Stock Prices Crash As FED Rate Hike Odds Climb to 50% in 2026
- US Congress Schedules Tokenization Hearing Next Week as CLARITY Act Advances
- Ethereum, XRP, and Solana Price Prediction As CLARITY Act Advances After Senate–White House Deal
- Why is Pi Network Price Up Today (March 21) Despite Market Wide Correction?
- Bittensor (TAO) Price Surges 20% After Nvidia CEO Comments
- Dogecoin, Shiba Inu, and Pepe Coin Price Prediction If BTC Holds $70k Level
- Cardano (ADA) Price Prediction Amid SEC/CFTC Policy Shift and ETF Update
- Crypto Stock to Watch As Bitcoin Price Crashed Below $70k; CRCL, COIN, MSTR, HOOD


