Price Analysis: Cosmos Secures Multi-Week High While Algorand Eyes A 9% Hike


Cosmos had finally managed to break over its immediate resistance of $36.94. Over the last 24 hours, the coin surged 9.6% and was trading at $38.34. It has been a relatively good month for both ATOM and ALGO.
For Algorand, too, this past week has brought in substantial recovery. Over the past week, ALGO registered a 10.8% gain. At press time, Algorand was trading for $1.77. The technical outlook remained positive for both the coins with sustained positive price action. Both Cosmos and Algorand could target growth of about 9%.
Cosmos/ATOM/USD Four Hour Chart
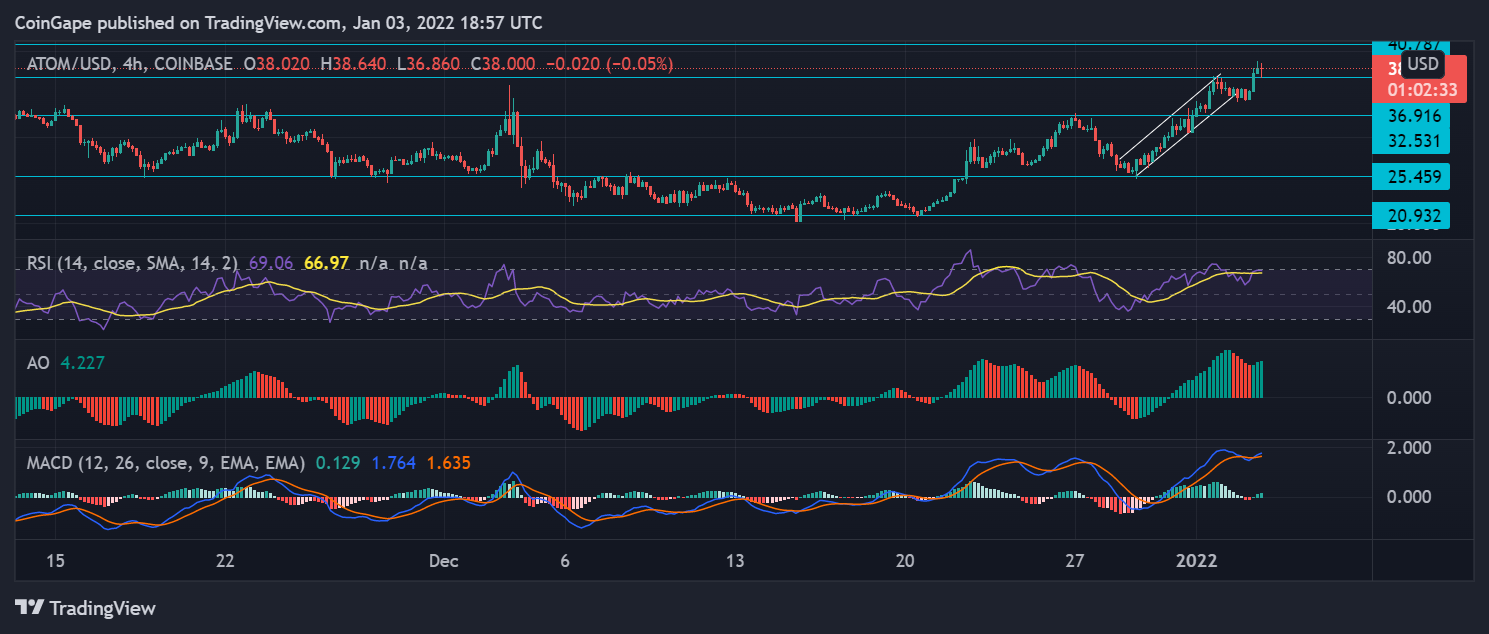
ATOM was trading within an ascending channel, securing higher highs in the past week. At press time, the coin was seen trading outside the channel. ATOM hadn’t gone past the $36.91 mark in almost two months. However, in the last 24 hours, the coin was seen trading above that price mark.
Overhead resistance for the coin was at $40.78, while the support level for the coin rested at $25.45 and then at $20.93. Near term, technicals displayed bullish sentiments with buying strength mounting in the market at the time of writing.
The Relative Strength Index was again seen near the overbought zone. The indicator had touched that level a couple of times the past month, with the reading indicating growth in buying volume.
The Awesome Oscillator displayed green histograms at the time of writing as the coin’s prices were positive with the significant gains it posted over the last 24 hours. MACD underwent a bullish crossover, after which the indicator displayed green histograms.
ALGO/USD Four Hour Chart
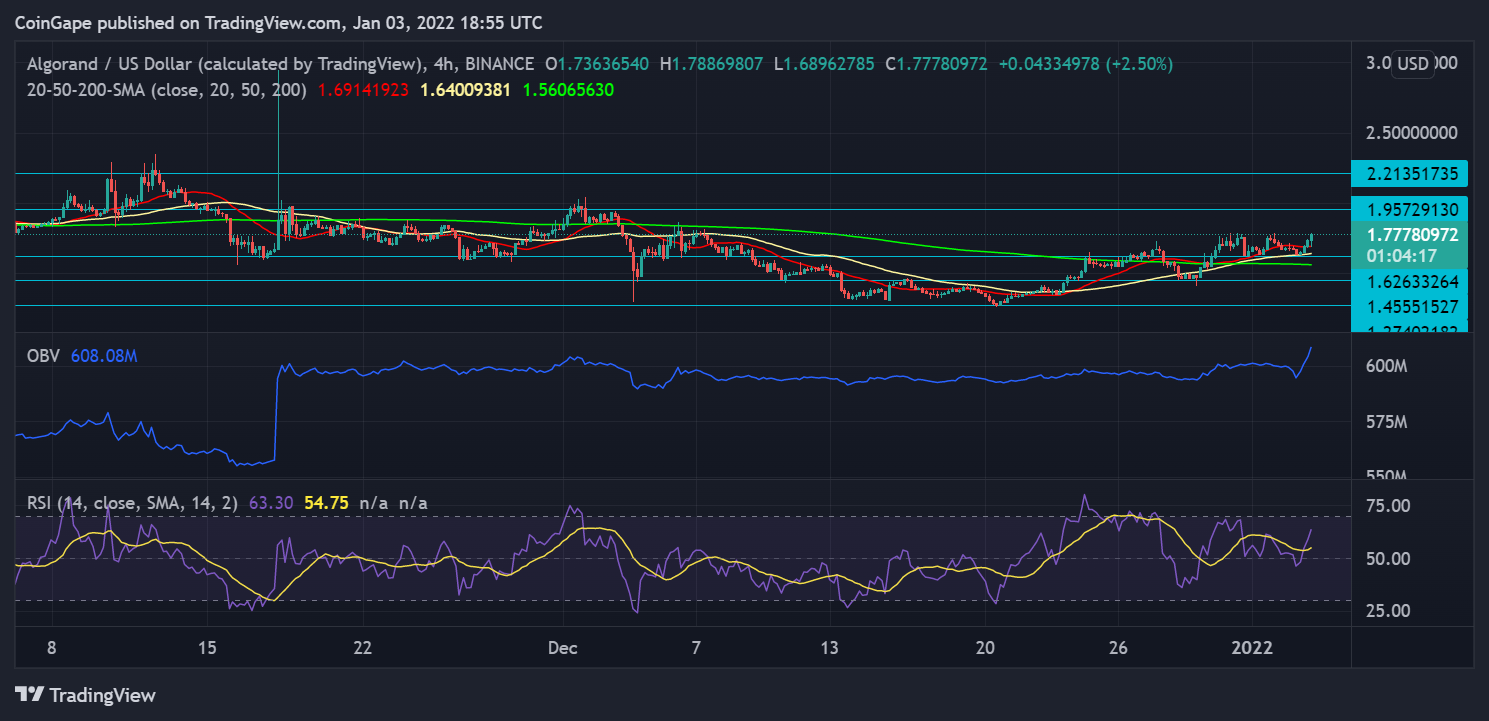
Algorand was priced at $1.77 with a price ceiling at $1.95. On the reverse, ALGO’s price floor stood at $1.62, and the coin had secured robust support at the $1.44 price level. Although ALGO mostly displayed trading within an immediate resistance and price floor, it registered significant gains. In the past 24 hours, the coin rose 8.4%.
On the four-hour chart, the ALGO price positioned above the 20-SMA line, signifying that buyers had taken over the price momentum in the market at the current moment. Other indicators, too, corresponded with the reading above.
On Balance Volume had spiked massively in November, displaying that there was a steep growth in buying volume in prices. At press time, OBV was bullish, and buying volume was high, as the indicator suggested.
The Relative Strength Index was above the half-line corresponding to the buying strength in the market. With continued buying strength, ALGO also could attempt to trade above its immediate resistance, which would bring in a 7% growth in its ROI over the coming trading sessions.

Why Trust CoinGape
CoinGape has covered the cryptocurrency industry since 2017, aiming to provide informative insights Read more… to our readers. Our journal analysts bring years of experience in market analysis and blockchain technology to ensure factual accuracy and balanced reporting. By following our Editorial Policy, our writers verify every source, fact-check each story, rely on reputable sources, and attribute quotes and media correctly. We also follow a rigorous Review Methodology when evaluating exchanges and tools. From emerging blockchain projects and coin launches to industry events and technical developments, we cover all facets of the digital asset space with unwavering commitment to timely, relevant information.
Delivered every day.
- Insights that move markets
- 100,000 active subscribers
Related Articles


- XRP News: Ripple Taps UK Investment Giant to Bring RWA Tokenization on XRP Ledger
- The Web3 Wallet Is Maturing. What Should We Expect?
- Godex Review: No-KYC exchange for private crypto conversions
- US Jobs Data: Bitcoin Falls to $66K as Wall Street Sees Rise in Nonfarm Payrolls
- Breaking: Binance, Franklin Templeton Launch Tokenized Fund Collateral for Institutions
- BTC Price Prediction Ahead of US Jobs Report, CPI Data and U.S. Government Shutdown
- Ripple Price Prediction As Goldman Sachs Discloses Crypto Exposure Including XRP
- Bitcoin Price Analysis Ahead of US NFP Data, Inflation Report, White House Crypto Summit
- Ethereum Price Outlook As Vitalik Dumps ETH While Wall Street Accumulates
- XRP Price Prediction Ahead of White House Meeting That Could Fuel Clarity Act Hopes
- Cardano Price Prediction as Bitcoin Stuggles Around $70k


