How This Technical Setup Could Blast Bitcoin Price To $11,000?


- Bitcoin on the verge of lift-off to $11,000 according to one cryptocurrency analyst.
- Bitcoin price has the potential to hold above $9,000 as per the signals of the MACD and the RSI.
After a period of holding above $9,200, Bitcoin dropped on Thursday to test support at $9,000. This time, buyers were keen on averting losses into the $8,000’s range. BTC/USD made a shallow bounced upwards, stepping above $9,100. However, the largest digital asset is trading at $9,130 following increased selling activity towards $9,200.
Related reading: Bitcoin Price Analysis: BTC/USD In Repeat Mode Until Breakdown To $7,200 After Testing $8,500
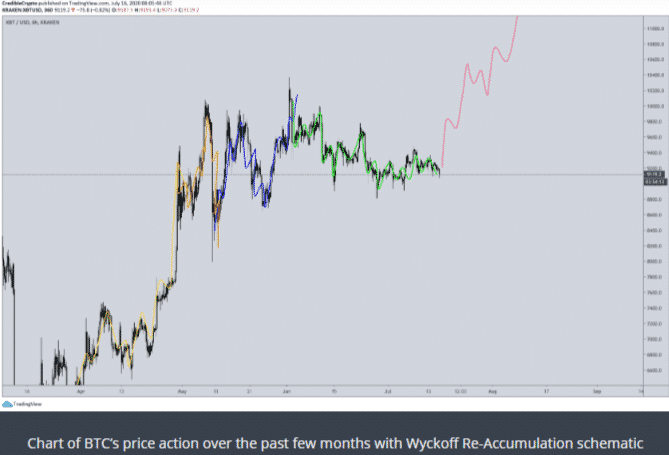
In spite of the breakdown witnessed, market volatility remains low. On the other hand, a popular technical analyst believes that Bitcoin could soon hit $11,000 as long as the Wyckoff schematics (technical indicators) play out as expected. The indicator was developed by Richard Wykoff and says that all markets trade in predictable patterns. Therefore, traders have higher chances of profitability, especially if they highlight the patterns early enough.
The analyst points out that Bitcoin is in the middle of a Re-Accumulation. This pattern is usually observed in classical middle uptrends. BTC/USD is in the “creek” phase of the pattern. Continuous action above within the pattern could place Bitcoin in a trajectory where it will be poised for a rally to $11,000 (see chart below).
Bitcoin consolidation movement in the last several weeks had driven most people on the edge. In fact, many are choosing to remain bearish, unlike the above analyst. However, during the crash to 3,800 in March another analyst used the Wykoff schematics to predict Bitcoin price reversal saying that it was trading in a Re-Accumulation pattern and not distribution. Some analysts are choosing to believe is struggling to hold in the Re-accumulation and would retreat to distribution thereby paving the way for a serious breakdown.
“BTC: Struggling to see the case for re-accumulation as opposed to distribution. If there is one its very weak. Volume profile is quite telling throughout this whole range.”
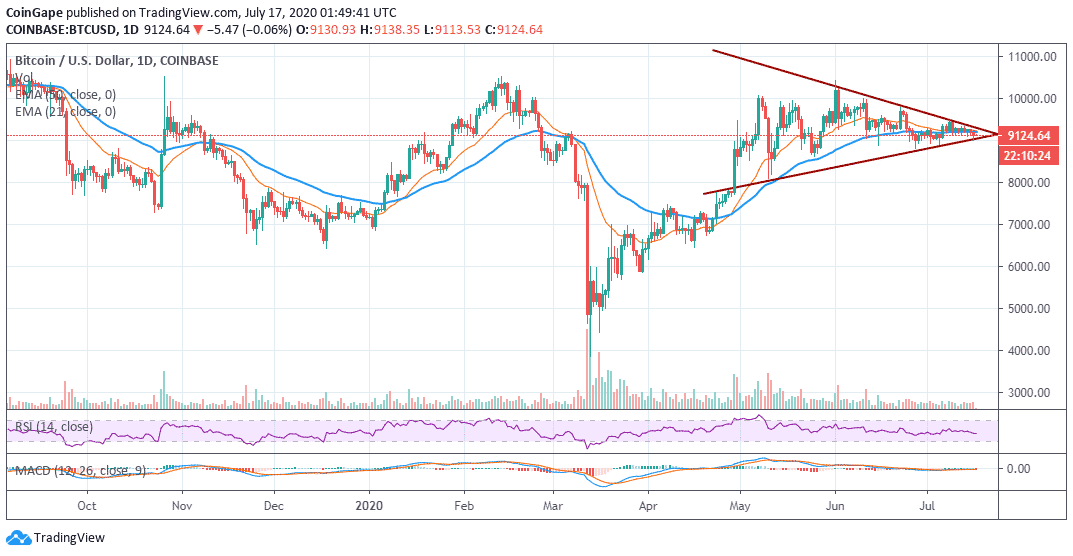
For now, Bitcoin has the potential to hold above $9,000 if not $9,100. The MACD is moving sidelong at the midline. The RSI reacted to the drop on Thursday but is currently holding at 45. With low trading volume playing out, less rapid price actions are expected in the near term.
Read more: Bitcoin’s Volatility Unaltered By Twitter Hack
BTC/USD daily chart
Bitcoin Intraday Levels
Spot rate: $9,124
Relative change: -4.84
Percentage change: -0.05%
Trend: Sideways bias
Volatility: Low
Instant Currency Exchange at BestChange with Ease
- Compare Rates Across 1000+ Exchanges
- Access 250+ Cryptocurrencies & Pairs
- Save Time with Real-Time Price Tracking


Why Trust CoinGape
CoinGape has covered the cryptocurrency industry since 2017, aiming to provide informative insights Read more… to our readers. Our journal analysts bring years of experience in market analysis and blockchain technology to ensure factual accuracy and balanced reporting. By following our Editorial Policy, our writers verify every source, fact-check each story, rely on reputable sources, and attribute quotes and media correctly. We also follow a rigorous Review Methodology when evaluating exchanges and tools. From emerging blockchain projects and coin launches to industry events and technical developments, we cover all facets of the digital asset space with unwavering commitment to timely, relevant information.

Delivered every day.
- Insights that move markets
- 100,000 active subscribers