 Buy $GGs
XTZ Price Analysis: Tezos [XTZ] Drops Slightly But Finds Strong Support At 100-Days EMA


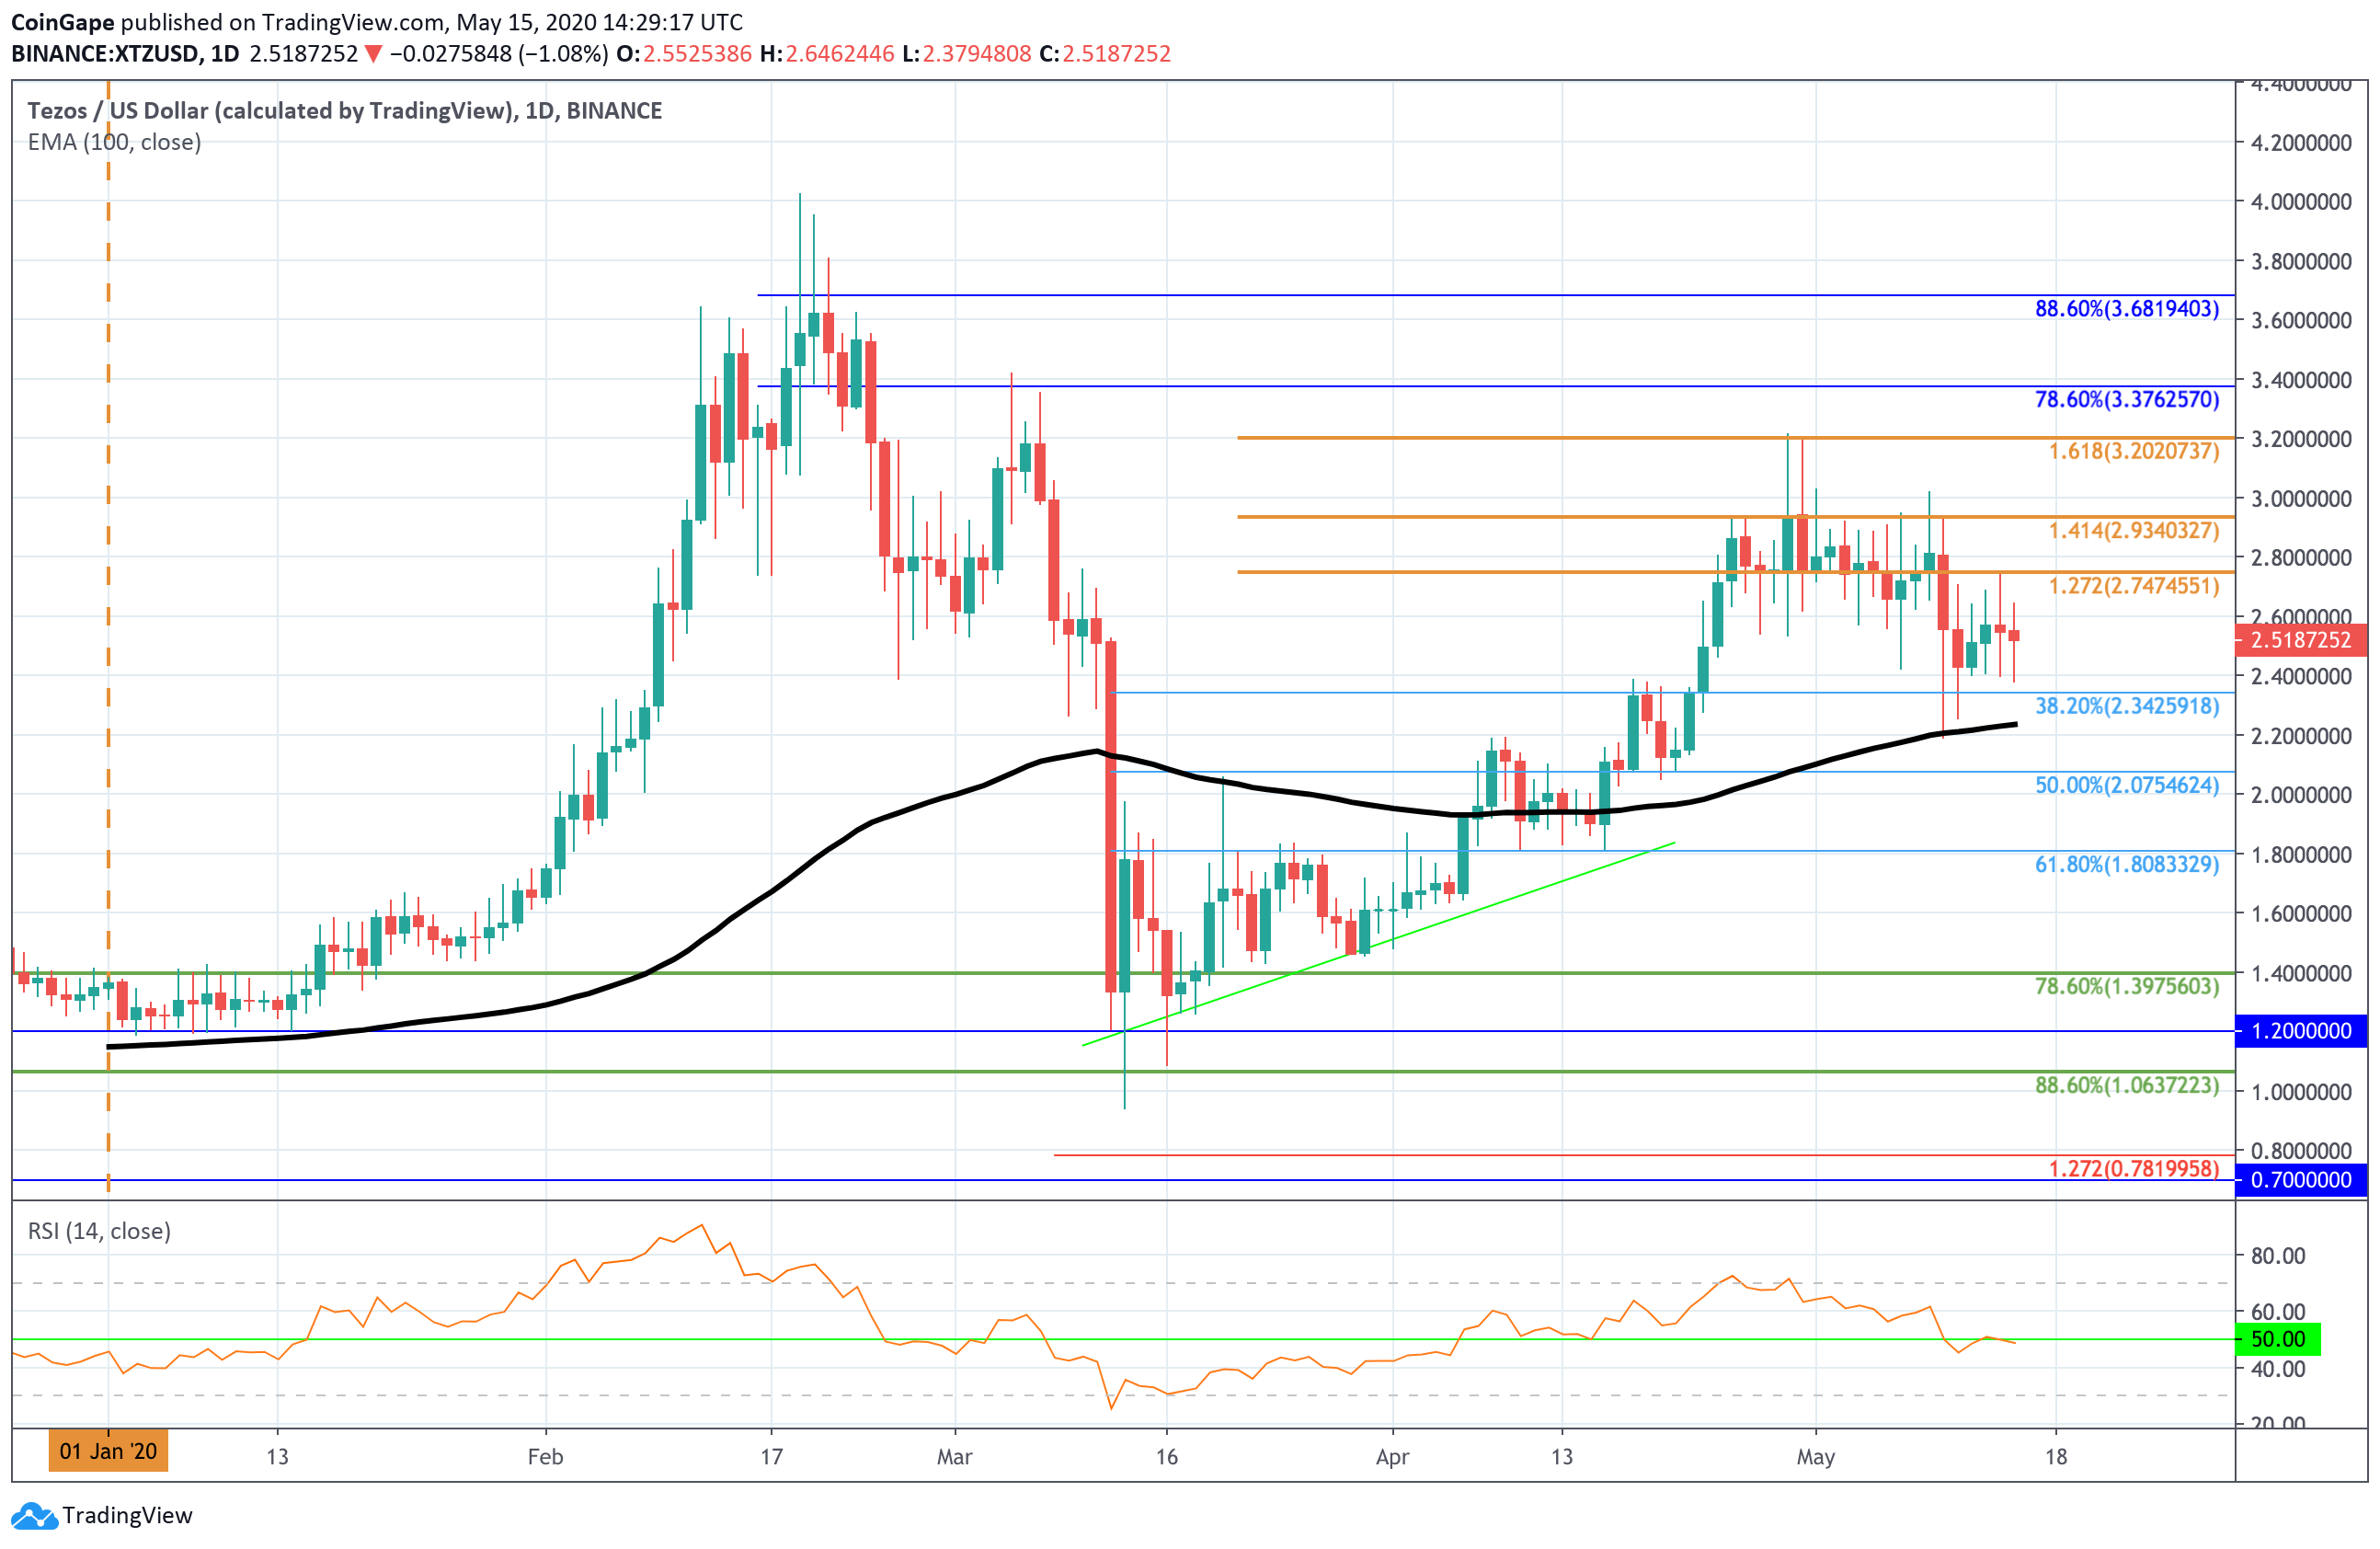
The toplines for Tezos [XTZ] Prices Analysis are:
- Tezos saw an 8% price decline this week as it drops to the $2.50 level.
- The cryptocurrency fell from a high of $3.00 which was seen earlier in the week.
Tezos saw a 8% price drop over the week after it fell from the $3.00 level to reach the current $2.50 level. The cryptocurrency spiked as low as $2.20 during the week where it managed to find some strong support at the 100-days EMA. It rebounded from here and closed above the $2.40 level which allowed it to slowly grind back toward $2.50.
Tezos is ranked in the 10th position as it currently holds a $118 million market cap valuation.
Tezos [XTZ] Price Analysis
XTZ/USD – Daily CHART – SHORT TERM
-
Market Overview
Analyzing the daily XTZ Price Analysis chart above, we can see that Tezos was trading sideways between $3.00 and $2.60 for the first 10-days of May 2020. Over the weekend, Bitcoin had dropped from $9,600 to $8,600 and this caused Tezos to drop quite steeply as it fell from $3.00 to reach as low as $2.20 where it found support at the 100-days EMA.
It rebounded from this support and climbed back above the $2.50 level. However, it seems to be struggling to pass the resistance at $2.74 now (1.272 Fib Extension).
-
Short term prediction: NEUTRAL
The drop beneath $2.40 turned Tezos neutral. The coin will now have to close above the $3.00 to turn bullish again. A break beneath $2.20 is likely to put Tezos in danger of turning bearish in the short term.
If the sellers push lower, the first level of support is located at $2.40. Beneath this, support lies at $2.34 (.382 Fib Retracement), $2.20 (100-days EMA), and $2.07 (.5 Fib Retracement).
On the other hand, the first level of resistance lies at $2.74 (1.272 Fib Extension). Above this, resistance is located at $2.93 (.1414 Fib Extension), $3.00, and $3.20 (1.618 Fib Extension).
-
Key Levels
Support: $2.50, $2.40, $2.34, $2.20, $2.07, $2.00, $1.80.
Resistance: $2.74, $2.94, $3.00, $3.20, $3.37, $3.68.
Liked this analysis? Follow our crypto analysis page at TradingView, for updates.
Play 10,000+ Casino Games at BC Game with Ease
- Instant Deposits And Withdrawals
- Crypto Casino And Sports Betting
- Exclusive Bonuses And Rewards


Why Trust CoinGape
CoinGape has covered the cryptocurrency industry since 2017, aiming to provide informative insights Read more… to our readers. Our journal analysts bring years of experience in market analysis and blockchain technology to ensure factual accuracy and balanced reporting. By following our Editorial Policy, our writers verify every source, fact-check each story, rely on reputable sources, and attribute quotes and media correctly. We also follow a rigorous Review Methodology when evaluating exchanges and tools. From emerging blockchain projects and coin launches to industry events and technical developments, we cover all facets of the digital asset space with unwavering commitment to timely, relevant information.

Delivered every day.
- Insights that move markets
- 100,000 active subscribers
Related Articles


- Peter Brandt Flips Bullish, Predicts Bitcoin Rally As Price Holds Above $70k
- XRP News: Institutional Use Case Expands as Doppler Finance Integrates WXRP for Multi-Chain Access
- Trump Tariffs: Bitcoin Faces Fresh Headwinds as 15% Global Tariffs Begin This Week Amid Iran War
- Bitget Unveils ‘Crypto Anti-Bias Pledge’ To Support Women’s Inclusion In Crypto
- U.S.-Iran War: Crypto Market Rebounds as Iran Reportedly Reaches Out To U.S. To End Conflict
- COIN Stock Analysis as Bitcoin Retests $72k Ahead of February NFP Data
- Robinhood Stock Price Prediction As Cathie Wood Buys $12M Dip in Bold ARK Move
- Bitcoin Price At Risk? Professor Who Predicted US-Iran War Says America Could Lose
- Gold Price Prediction March 2026: Rally, Crash, or Record Highs?
- RIOT Stock Prediction as Needham, Piper Sandler Slash Target After Earnings
- Cardano Price Outlook As Charles Hoskinson Warns Over CLARITY Act


