Bitcoin Price Analysis: BTC Trades Above $57K As MicroStrategy Extends The Adoption Curve


Bitcoin (BTC) price leaped by approximately $4,756 on November 29 rising to brush shoulders with $59,000 for the fist time since losing this support last week. The uptick was triggered by the disclosure by MicroStrategy that they had added more BTC to their reserves. Although Bitcoin price analysis reveals that it has since recoiled towards the $57,000 support wall.
MicroStrategy Purchases 7,002 More BTC
MicroStrategy, the business intelligence firm that became the trendsetter Institutional Bitcoin (BTC) adoption has purchased 7,002 more BTC . Michael Saylor, the CEO of the firm revealed in a Tweet that they invested over $414 million and bought the latest batch of BTC at an average price of $59,187. The latest acquisition brings their number of Bitcoins in their treasury to $ 121,044 BTC acquired for approximately $3.57 billion at an average price of roughly $29,534 per Bitcoin.
As a leader in Bitcoin adoption, MicroStrategy not only “hodls” thousands of Bitcoins but also encourages and motivates other institutions and publicly listed companies to add BTC o their balance sheets.
Bitcoin Price Analysis: $58,700 Level Crucial For BTC Breaking Out Upwards
Carrying out Bitcoin price analysis using the price action as displayed on the four-hour chart reveals that BTC/USD has formed a falling wedge. The BTC price is at $57,160 and must rise above the resistance line to rekindle hopes of an upward movement. A decisive bullish breakout will be achieved once Bitcoin price rises above the 100-period Simple Movign Average (SMA) at $57,769.
However, as things appear, BTC appears to be consolidating above the 50 SMA as validated by then flattening out of the Relative Strength Index (RSI) indicator. The Movign Average Convergence Divergence (MACD) indicator is also flattening close to the zero line, adding credence to the consolidation.
BTC/USD Four-Hour Chart
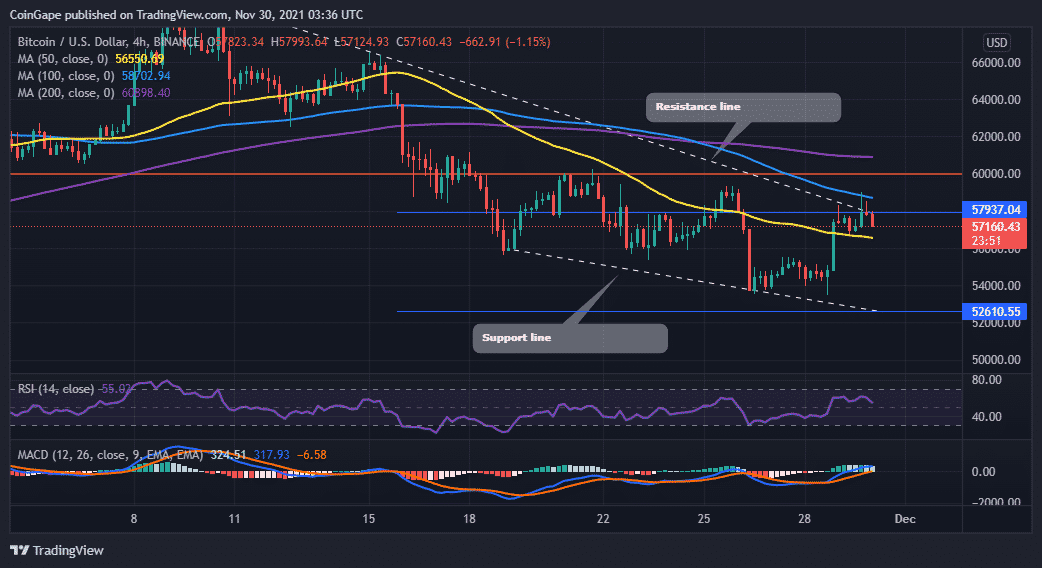
Should Bitcoin move to favor the bears, it will have to close below the immediate support provided by the $57,000 psychological level. If this happens, the big crypto may drop towards the SMA at $56,550. A drop further could see BTC drop to reach the target of the falling wedge at $52,610, embraced by the wedge’s support line.
In the meantime, investors are advised to do their own Bitcoin price analysis keeping in mind the pointers made here before making a move.

Why Trust CoinGape
CoinGape has covered the cryptocurrency industry since 2017, aiming to provide informative insights Read more… to our readers. Our journal analysts bring years of experience in market analysis and blockchain technology to ensure factual accuracy and balanced reporting. By following our Editorial Policy, our writers verify every source, fact-check each story, rely on reputable sources, and attribute quotes and media correctly. We also follow a rigorous Review Methodology when evaluating exchanges and tools. From emerging blockchain projects and coin launches to industry events and technical developments, we cover all facets of the digital asset space with unwavering commitment to timely, relevant information.

Delivered every day.
- Insights that move markets
- 100,000 active subscribers
Related Articles


- Fed’s Chris Waller Says Support For March Rate Cut Will Depend On Jobs Report
- Breaking: Tom Lee’s BitMine Adds 51,162 ETH Amid Vitalik Buterin’s Ethereum Sales
- Breaking: Michael Saylor’s Strategy Makes 100th Bitcoin Purchase, Buys 592 BTC as Market Struggles
- Satoshi-Era Whale Dumps $750M BTC as Hedge Funds Pull Out Billions in Bitcoin
- XRP Sees Largest Realized Loss Since 2022, History Points to Bullish Price Run: Report
- Top 3 Meme Coins Price Prediction As BTC Crashes Below $67k
- Top 4 Reasons Why Bitcoin Price Will Crash to $60k This Week
- COIN Stock Price Prediction: Will Coinbase Crash or Rally in Feb 2026?
- Shiba Inu Price Feb 2026: Will SHIB Rise Soon?
- Pi Network Price Prediction: How High Can Pi Coin Go?
- Dogecoin Price Prediction Feb 2026: Will DOGE Break $0.20 This month?


