Bitcoin Price Analysis: The BTC Coin Drops Below Another Crucial Support Of 0.5 Fibonacci Retracement Level


The BTC coin is still trapped in a correction phase that has dropped below the 0.5 FIB level. If the coin manages to sustain below the coin $48500, the coin will extend this retracement. However, a piece of positive news for this Bitcoin is that its hash rate has breached the previous All-time High of 180ET/s (7-day moving average).
Key technical points:
- The BTC coin bears reclaim the 200-day EMA
- The intraday trading volume in the BTC coin is $26.9 Billion, indicating a 3.13% loss.

Source- BTC/USD chart by Tradingview
On November 10th, the BTC coin marked its New All-Time High at $69000 and entered into a usual correction phase. However, this minor pullback has extended more than the holder’s expectation and has recently breached the crucial support of the 0.5 FIB level and 200 EMA line together.
So far, the coin has lost 30% of its value from the previous swing high and is currently trying to retest the broken resistance of $64870. The coin could drop to the $44000 mark if the price sustains below this.
The daily Relative Strength Index(56) displays a steady downtrend towards the oversold territory.
Bitcoin Hash rate Fully Recover From Impacts of China Ban
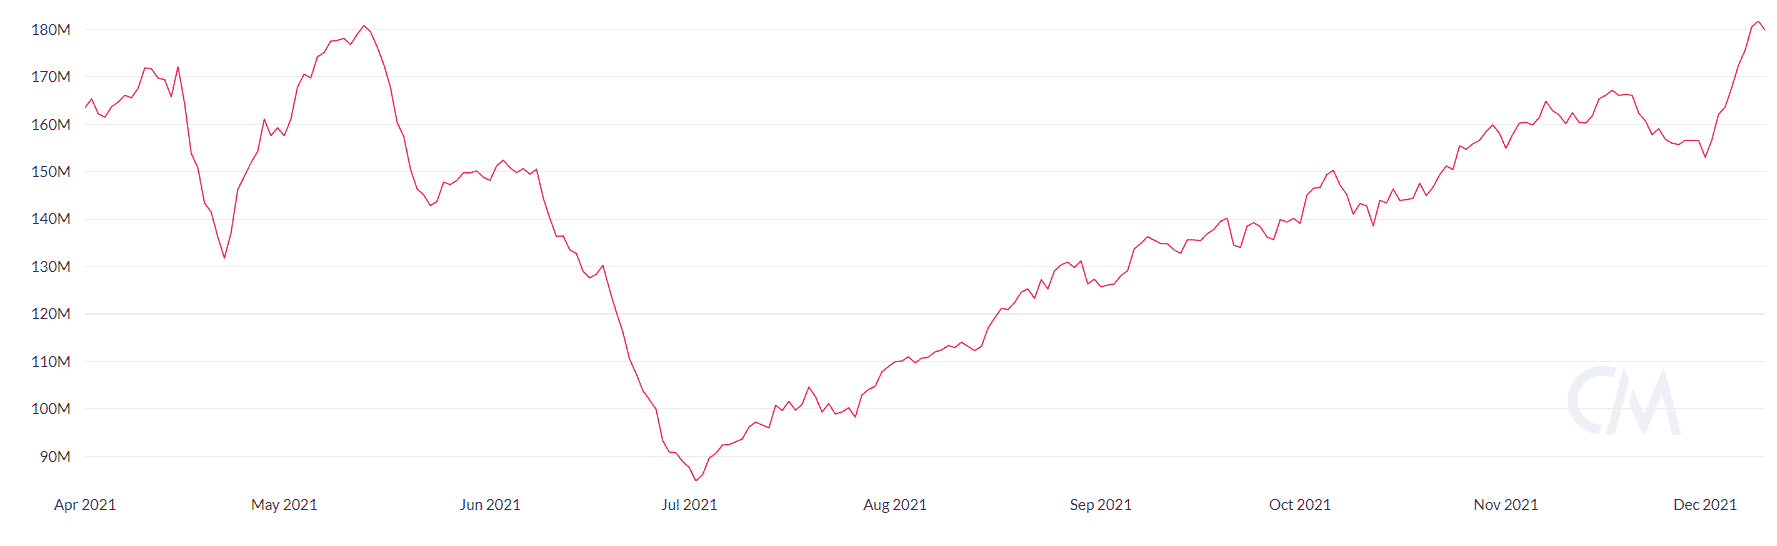 Source- Coinmetrics
In May, Bitcoin hash rate took a significant toll when China banned bitcoin services in their country.
As China was the major contributor to the world’s bitcoin mining, the hashrate for BTC experienced a negative impact on its value and started falling lower and lower. By the end of June, it lost 50 % of its value and plunged to the 84.8 ET/s(7-day moving averages). However, North American bitcoin mining companies emerged and did their job to stabilize the network’s hash rate.
From July, the metric initiated the steady rally in its chart, which recently broke the previous All Time-High of 180ET/s (7-day moving average) and is currently moving around 181.5ET/s, indicating a 113% increase in five months.

Why Trust CoinGape
CoinGape has covered the cryptocurrency industry since 2017, aiming to provide informative insights Read more… to our readers. Our journal analysts bring years of experience in market analysis and blockchain technology to ensure factual accuracy and balanced reporting. By following our Editorial Policy, our writers verify every source, fact-check each story, rely on reputable sources, and attribute quotes and media correctly. We also follow a rigorous Review Methodology when evaluating exchanges and tools. From emerging blockchain projects and coin launches to industry events and technical developments, we cover all facets of the digital asset space with unwavering commitment to timely, relevant information.

Delivered every day.
- Insights that move markets
- 100,000 active subscribers
Related Articles


- Bitcoin vs. Gold: Expert Predicts BTC’s Underperformance as Options Traders Price in $20K Gold Target
- CLARITY Act: White House to Hold Another Meeting as Crypto and Banks Stall on Stablecoin Yield Deal
- Bitcoin as ‘Neutral Global Collateral’? Expert Reveals How BTC Price Could Reach $50M
- XRP Ledger Validator Spotlights Upcoming Privacy Upgrade as Binance’s CZ Pushes for Crypto Privacy
- Harvard Management Co (HMC) Cuts BlackRock Bitcoin ETF Exposure by 21%, Rotates to Ethereum
- Dogecoin, Shiba Inu, Pepe Coin Price Predictions As BTC Crashes Below $68k
- Ethereum Price Outlook as Harvard Shifts Focus from Bitcoin to ETH ETF
- HOOD and COIN Stock Price Forecast as Expert Predicts Bitcoin Price Crash to $10k
- XRP Price Prediction Ahead of Supreme Court Trump Tariff Ruling
- Crypto Price Prediction For This Week: Dogecoin, Solana and Cardano
- Bitcoin Price Prediction: How Could Brazil’s Strategic Bitcoin Reserve Proposal Impact BTC?


