 Claim Card
Bitcoin Price Prediction: BTC Ready For A 5% Rebound To $50,000


Bitcoin price correction continued on December 13 undoing all the gains that began on December 10 to reclaim the $50,000 crucial level. Bitcoin is down 2% to trade at $48,274. The price correction has made the BTC market cap to tank below the $1 trillion mark with its market dominance dropping to 41.52%. Can the big crypto rise above $50,000 in the near future?
Bitcoin price ready for a 5% rebound to $50,827
Bitcoin (BTC) price action has formed a pennant on the four-hour chart which has triggered today. The triggering of the chart pattern suggests decreasing price volatility as BTC/USD consolidates inside the pennant.
The horizontal movement of the Relative Strength Index (RSI) at 50 validates this price consolidation. The sideways movement of the Moving Average Convergence Divergence (MACD) indicator points to a price consolidation.
However, the MACD has sent a buy Bitcoin signal on the four-hour chart. This happened when the blue MACD line crossed above the orange signal line indicating that the market sentiment has turned bullish.
Therefore, if the price of the largest cryptocurrency by market cap rises above the pennant’s resistance line at $48,308, it will confirm a bullish breakout. However, a decisive bullish breakout will be achieved after Bitcoin price rises above the 50-four-hour SMA at $48,833. After which, the December 12 range high above $50,827 will be the next logical move, representing a 5.39% rise from the current price.
BTC/USD Four-Hour Chart
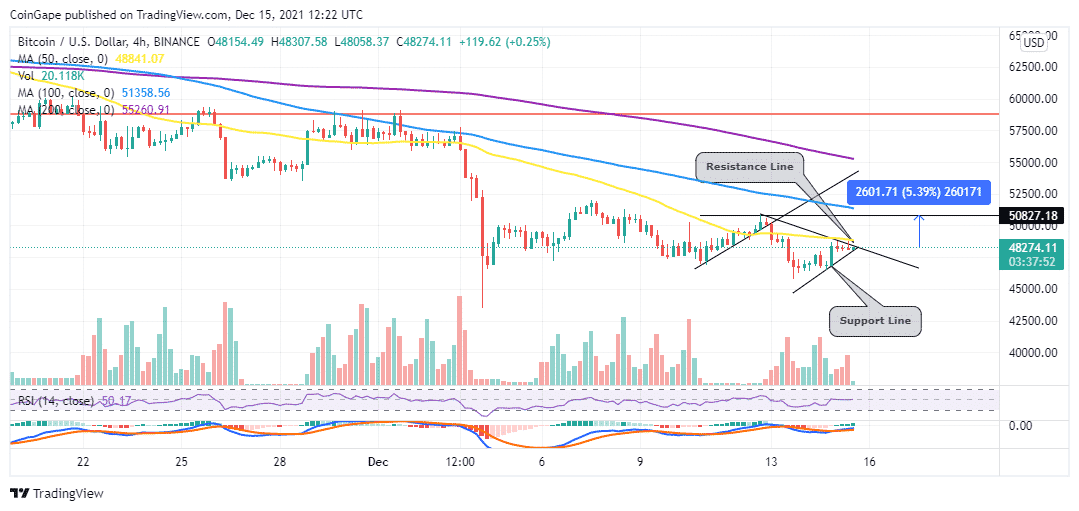
However, if BTC price favours the bears and drops below the pennant’s support line at $48,067, it will trigger massive sell orders that are likely to take Bitcoin towards the $47,000 psychological level.
A drop further could see Bitcoin drop further towards the $46,800 support floor or even towards the target pf the pennant chart pattern around $44,600.
At the moment, investors should hold on to their BTC or USD’s and wait to see which direction the big crypto take.

Why Trust CoinGape
CoinGape has covered the cryptocurrency industry since 2017, aiming to provide informative insights Read more… to our readers. Our journal analysts bring years of experience in market analysis and blockchain technology to ensure factual accuracy and balanced reporting. By following our Editorial Policy, our writers verify every source, fact-check each story, rely on reputable sources, and attribute quotes and media correctly. We also follow a rigorous Review Methodology when evaluating exchanges and tools. From emerging blockchain projects and coin launches to industry events and technical developments, we cover all facets of the digital asset space with unwavering commitment to timely, relevant information.

Delivered every day.
- Insights that move markets
- 100,000 active subscribers
Related Articles


- Crypto Exchange HashKey Launches RWA Issuance for Institutions Amid Tokenization Boom
- Just-In: Ethereum Foundation Begins Staking 70,000 ETH, Futures Open Interest Bounces
- 8 Best White Label RWA Tokenization Platform Development Companies
- Hong Kong Stablecoin Firm RedotPay Targets $1B Raise in Potential US. IPO Debut
- Crypto Market Crash: Glassnode & 10x Research Warn Deeper Bitcoin Price Fall Ahead
- XRP Price Outlook as Clarity Act Passage Odds Plunge to 53%
- COIN Stock Risks Crashing to $100 as Odds of US Striking Iran Jump
- MSTR Stock Price Predictions As Michael Saylor’s Strategy Makes 100th BTC Purchase
- Top 3 Meme Coins Price Prediction As BTC Crashes Below $67k
- Top 4 Reasons Why Bitcoin Price Will Crash to $60k This Week
- COIN Stock Price Prediction: Will Coinbase Crash or Rally in Feb 2026?


