GALA Price Analysis: Descending Triangle Pattern Threatens More 16% Fall


The GALA token indicates that the overall trend is still bullish. This pair is currently in a retracement phase which has caused a 50% discount on the token’s value. Moreover, the price has recently given a bearish breakout from a descending triangle pattern, indicating extension for this down rally.
Key technical points:
- The GALA token price drops below the 200 EMA in the 4-hour time frame chart
- The intraday trading volume in the GALA token is $171.4 Million, indicating a 53.44% gain.
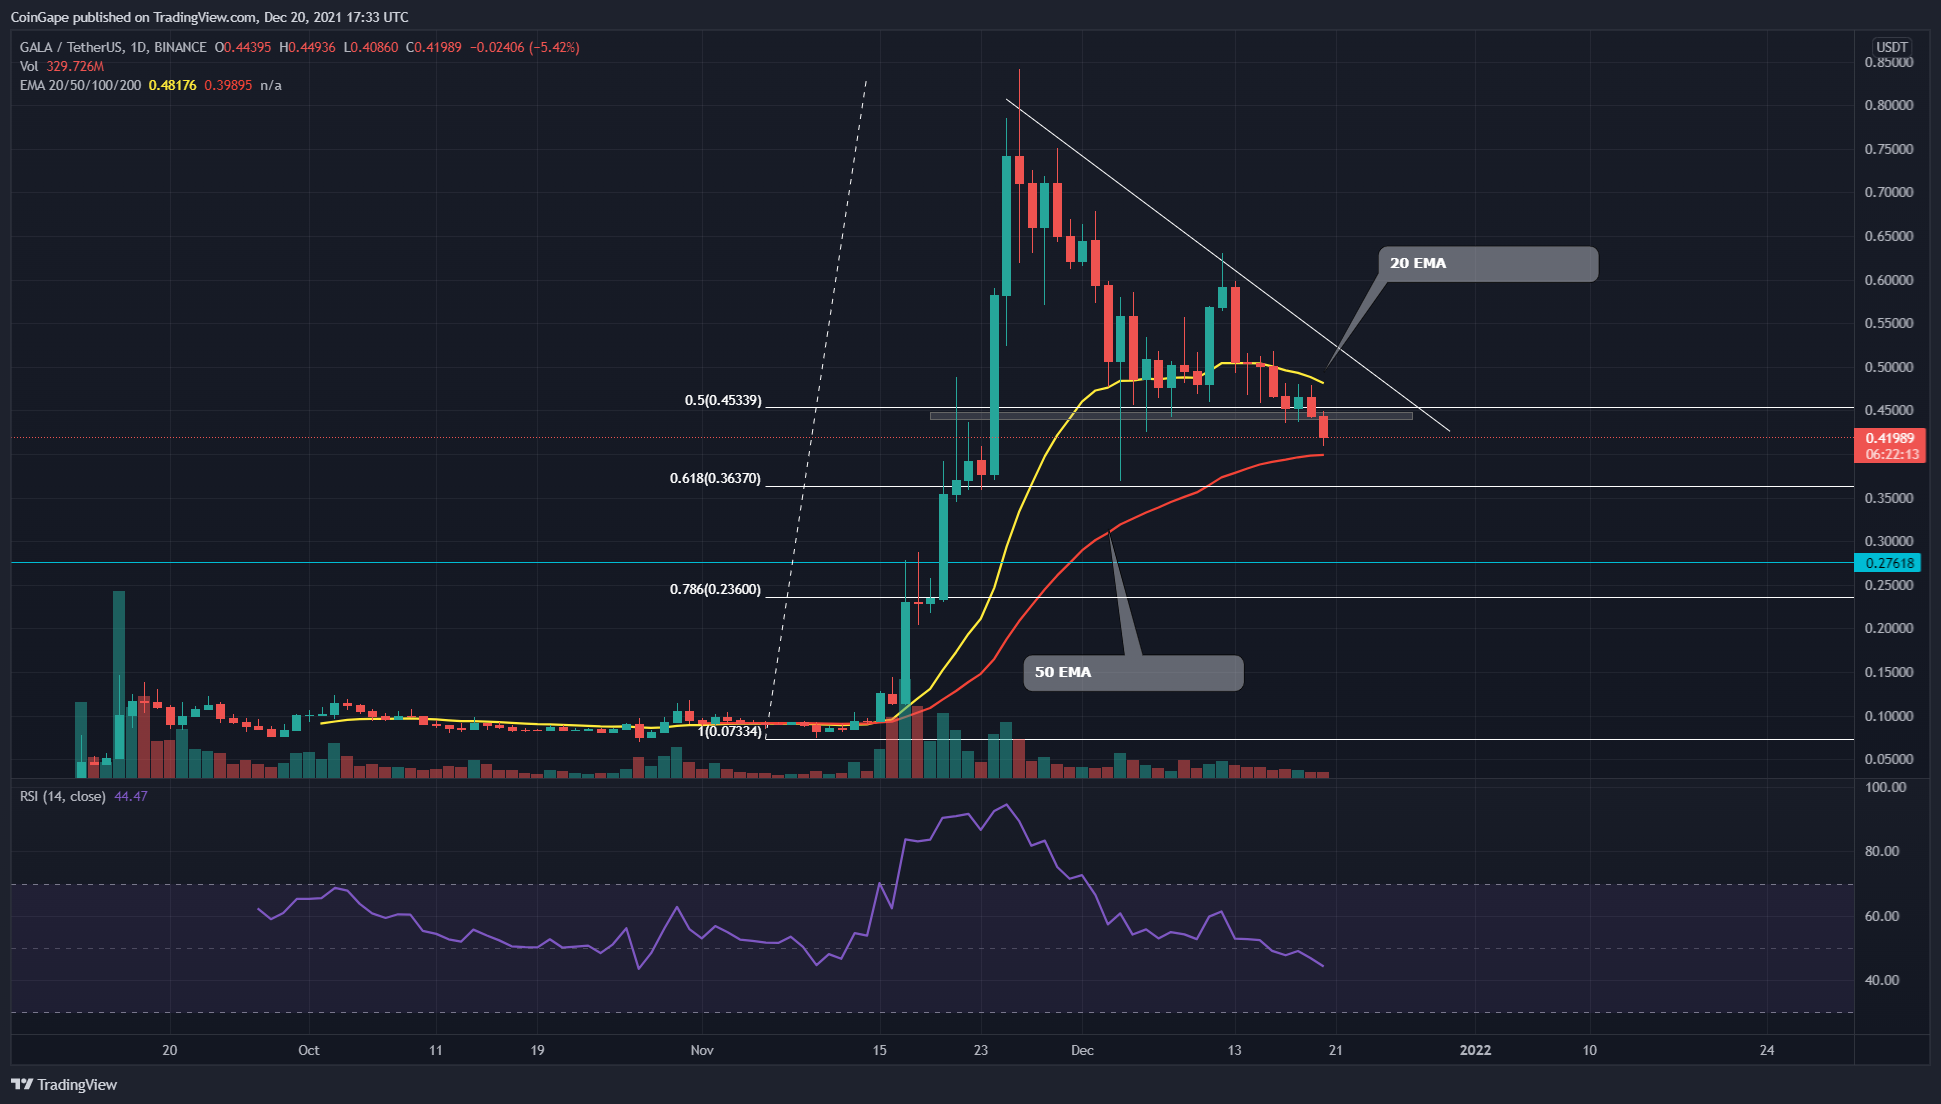 Source- =Tradingview
The last time when we covered an article on GALA/USD, the token price was still hovering above the 0.5 Fibonacci retracement level($0.44), trying to obtain sufficient support from it. On December 11th, the price tried to bounce back from this support with a bullish engulfing candle but failed to cross the $0.615 resistance.
The token price was rejected from this level with an evening star candle pattern, dropping this pair back to the $0.44 support. Anyhow this whole structure revealed a descending triangle pattern, suggesting a further fall in its price.
The daily Relative Strength Index (44) steadily approaching the oversold zone.
GALA/USD 4-hour time frame chart
 Source- Tradingview
Today, the GALA token price broke down the neckline support level of descending triangle pattern. Along with this support, this pair also breached other crucial like 0.5 FIB level and 200 EMA, indicating a significant loss for the market bulls.
Today, the GALA token price broke down the neckline support level of descending triangle pattern. Along with this support, this pair also breached other crucial like 0.5 FIB level and 200 EMA, indicating a significant loss for the market bulls.
The GALA token price has recently plummeted below the crucial EMAs (20, 50, 100, and 200), indicating a bearish trend. Moreover, the chart also shows a bearish crossover the 20 and 100, encouraging even more sellers in the market.
The Moving average convergence divergence shows the MACD and signal line moving below the neutral zone (0.00), projecting a bearish momentum in the price.
Why Trust CoinGape
CoinGape has covered the cryptocurrency industry since 2017, aiming to provide informative insights Read more… to our readers. Our journal analysts bring years of experience in market analysis and blockchain technology to ensure factual accuracy and balanced reporting. By following our Editorial Policy, our writers verify every source, fact-check each story, rely on reputable sources, and attribute quotes and media correctly. We also follow a rigorous Review Methodology when evaluating exchanges and tools. From emerging blockchain projects and coin launches to industry events and technical developments, we cover all facets of the digital asset space with unwavering commitment to timely, relevant information.
Delivered every day.
- Insights that move markets
- 100,000 active subscribers
Related Articles


- Sui ETF Nears Approval as Grayscale Amends S-1 with US SEC
- XRP Ledger Crosses $1 Billion in Tokenized Assets Amid Rising Institutional Interest
- FOMC Meeting Tomorrow: Will Federal Reserve Lower Interest Rates?
- Silver Records Over $1B in Volume on Hyperliquid, Surpassing Solana and XRP
- Crypto Set to Catch Up Once Gold and Silver Take a Breather: Tom Lee
- XRP Price Prediction as Ripple Scores Big Partnership in Cash-Rich Saudi Arabia
- Bitcoin Price Prediction As Gold Breaks All-Time High
- Bitcoin and XRP Price At Risk As US Govt. Shutdown Odds Reach 73%
- PEPE vs PENGUIN: Can Pengu Price Outperform Pepe Coin in 2026?
- Binance Coin Price Outlook As Grayscale Files S-1 for BNB
- Solana Price Prediction as SOL ETF Inflows Outpace BTC and ETH Together


