Ethereum Price Analysis: ETH Price Approaches 0.5% Fibonacci Retracement On Weekly Chart


ETH price shows a movement that depicts the bearish undercurrent. Following, Thursday’s aftermath the price took some breather below $2,700. However, the buyers are advised to be cautious as the price is still under pressure and further lower movement cannot be ruled out.
- ETH price fell for the third straight day on Saturday amid sustained selling momentum.
- Expect more losses if the price closes below the 0.5% Fibonacci Retracement level on weekly basis.
- The asset locked more than 5% weekly losses as trades below $2,700.
ETH price consolidates
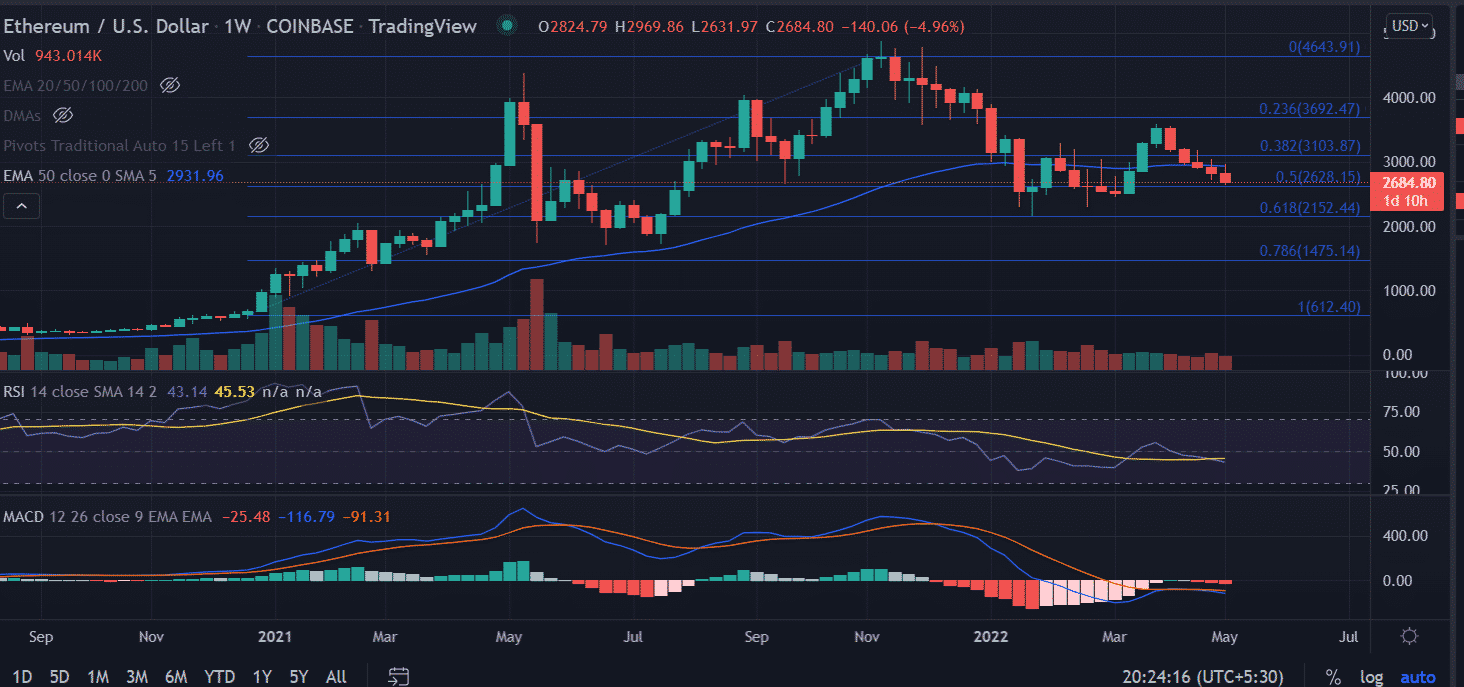
On the weekly chart, the ETH price has formed two lower lows extending from $48,000 to $35,000 since November whereas only one swing low at $2,159 in January. Analyzing further, the price remains pressured below the 50-day EMA (Exponential Moving Average) at $2,930.
In addition to that, the price dwindles near the 0.5% Fibonacci retracement level at $2,628. The trading volume has been consistent with the fall in the price. Looking at mentioned arguments, we expect ETH to produce one lower low this time.
To do so, two things would be required, one a weekly close below $2,500, and the breakage below $2,159. If that happens then get ready for $1,700 in the medium to short-term.
However, things look quite pessimistic for the second-largest cryptocurrency a shift in the bullish sentiment would counter the prevailing bearish sentiment. A spike in buy orders could push the price to test the 50-day ema at $2,969. This might fuel the investor’s demand for $3,000.
As of press time, ETH/USD holds at $2,680, down 0.43% for the day.
Technical indicators:
RSI: The weekly relative strength index oscillates near the average line. Any downtick in the indicator could strengthen the bearish outlook on the asset.
MACD: The moving average convergence divergence trades below the midline.

Why Trust CoinGape
CoinGape has covered the cryptocurrency industry since 2017, aiming to provide informative insights Read more…to our readers. Our journal analysts bring years of experience in market analysis and blockchain technology to ensure factual accuracy and balanced reporting. By following our Editorial Policy, our writers verify every source, fact-check each story, rely on reputable sources, and attribute quotes and media correctly. We also follow a rigorous Review Methodology when evaluating exchanges and tools. From emerging blockchain projects and coin launches to industry events and technical developments, we cover all facets of the digital asset space with unwavering commitment to timely, relevant information.

Related Articles


- Crypto Market Crash: Glassnode & 10x Research Warn Deeper Bitcoin Price Fall Ahead
- Operation Chokepoint: Federal Reserve Advances Proposal to End Crypto Debanking
- LUNC News: Terraform Labs Administrator Sues Jane Street for Terra-LUNA Crisis
- Crypto.com Joins Ripple, Circle With Conditional Bank Charter Approval Amid WLFI’s Probe
- Michael Saylor Says Quantum Risk To Bitcoin Is a Decade Away, Describes it as ‘FUD’
- COIN Stock Risks Crashing to $100 as Odds of US Striking Iran Jump
- MSTR Stock Price Predictions As Michael Saylor’s Strategy Makes 100th BTC Purchase
- Top 3 Meme Coins Price Prediction As BTC Crashes Below $67k
- Top 4 Reasons Why Bitcoin Price Will Crash to $60k This Week
- COIN Stock Price Prediction: Will Coinbase Crash or Rally in Feb 2026?
- Shiba Inu Price Feb 2026: Will SHIB Rise Soon?


