XRP Price Prediction: Major Correction Ahead if Buyers Lose this Key Support


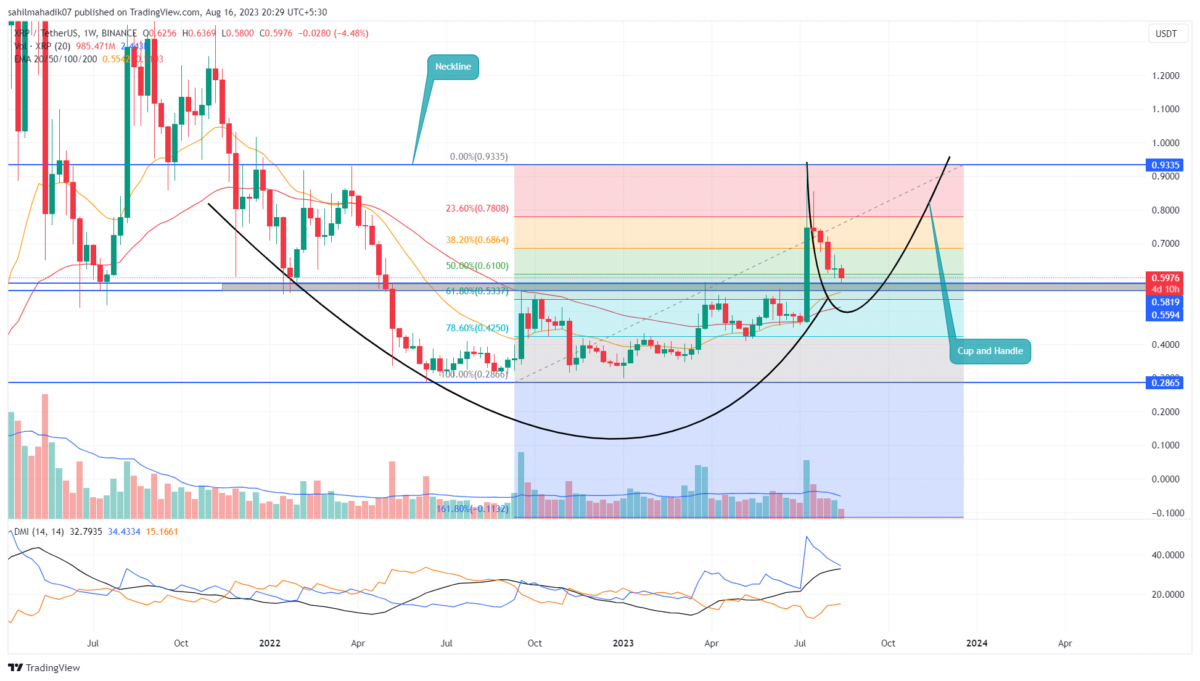
In the weekly time frame chart, the XRP price shows the formation of a cup and handle pattern. The chart setup often spotted at the bottom indicates a high probability of bullish reversal. As of now, the coin price trades at $0.59, and is forming the handle portion or pullback in the prevailing rally. Will this retracement lead to a fresh uptrend in the Fifth largest cryptocurrency?
Also Read: XRP Sideways Market Structure Extends – Can Shorts Turn Profitable?
XRP Price Analysis: Key Points
- XRP correction backed by decreasing volume reflects the buyer exhaustion
- The Crypto buyers can witness suitable demand pressure from the $0.56 support
- The intraday trading volume in the XRP is $1.6 Billion, indicating a 93% gain.
 Source: Tradingview
For over a month, the XRP price has been in a correction phase, where the prices plunged from the June 13th high of $0.938 to a $0.58 low. This correction registered a loss of 37.6% loss and plunged to the 50% Fibonacci retracement level.
A 50% retracement level is considered healthy to absorb the excess supply pressure and stabilize the asset for higher levels. By the press time, this altcoin trades at $0.592 and hovers above the $0.58-$0.56 support zone.
The buyers should manage to sustain this level to recuperate the exhausted bullish momentum. A potential bounce back from $0.58 will bolster bulls for a 58% rally and challenge the $0.935 neckline resistance.
A breakout above the $0.935 neckline will give a better confirmation of trend reversal.
[converter id=”xrp-xrp” url=”https://coingape.com/price/converter/xrp-to-usd/?amount=1″]
Will XRP Extend Correction Trend?
Amid the increasing uncertainty in the crypto market, the XRP price could continue to consolidate above $0.58. However, considering a pessimistic approach, the sellers could give a breakdown below the mentioned support. With this breakdown, the coin price will also lose 61.8% FIB level, and bolster the price for a major correction to $0.426, or lower.
- Exponential Moving Average: The weekly EMAs(20 and 50) gathering near $0.56 could offer additional support to buyers.
- Directional Movement Index: A positive crossover state between the DI+(blue) and DI-(orange) slope reflects buyers hold enough momentum to trigger a bullish reversal.

Why Trust CoinGape
CoinGape has covered the cryptocurrency industry since 2017, aiming to provide informative insights Read more…to our readers. Our journal analysts bring years of experience in market analysis and blockchain technology to ensure factual accuracy and balanced reporting. By following our Editorial Policy, our writers verify every source, fact-check each story, rely on reputable sources, and attribute quotes and media correctly. We also follow a rigorous Review Methodology when evaluating exchanges and tools. From emerging blockchain projects and coin launches to industry events and technical developments, we cover all facets of the digital asset space with unwavering commitment to timely, relevant information.

Related Articles


- Operation Chokepoint: Federal Reserve Advances Proposal to End Crypto Debanking
- LUNC News: Terraform Labs Administrator Sues Jane Street for Terra-LUNA Crisis
- Crypto.com Joins Ripple, Circle With Conditional Bank Charter Approval Amid WLFI’s Probe
- Michael Saylor Says Quantum Risk To Bitcoin Is a Decade Away, Describes it as ‘FUD’
- White House Proposes Stablecoin Rewards Compromise as CLARITY Act Odds Drop to 44%
- COIN Stock Risks Crashing to $100 as Odds of US Striking Iran Jump
- MSTR Stock Price Predictions As Michael Saylor’s Strategy Makes 100th BTC Purchase
- Top 3 Meme Coins Price Prediction As BTC Crashes Below $67k
- Top 4 Reasons Why Bitcoin Price Will Crash to $60k This Week
- COIN Stock Price Prediction: Will Coinbase Crash or Rally in Feb 2026?
- Shiba Inu Price Feb 2026: Will SHIB Rise Soon?


