Polkadot Price Analysis: V-Shaped Recovery in DOT Coin Threatens Another Resistance Level


The correction phase started from the later part of November, plunged the Polkadot price to the $23.5 mark. The buyers showed strong interest in this discounted price, resulting in quick recovery in this coin. Currently, the pair is climbing higher resistance levels one after another, initiating a new rally.
Polkadot Key technical points:
- The DOT bulls trying to reclaim the 200-day EMA
- The daily RSI line has crossover above the neutral line(50)
- The 24-hour trading volume in the Polkadot coin is $1.09 Billion, indicating a 29.96% gain.
 Source-Tradingview
The Last time when we covered an article on Polkadot, the pair was trying to reverse from the $26.3 support with a morning star candle pattern. However, the strong resistance from the $30 mark rejected the coin and dropped it to the lower support of $23.5.
The pair retested this bottom support on December 20th, and the intense demand pressure brought a sudden recovery from the very next day. The coin has gained 40% in one week and breached a resistance level of $30.5.
The DOT coin has recently crossed above the 200 EMA line, providing an excellent edge for the long trader if the price sustains above it.
The daily Relative Strength Index (57) showed significant recovery from the oversold territory. Moreover, the RSI line has entered the bullish zone and is moving high above the 14-EMA.
DOT/USD 4-hour time frame chart
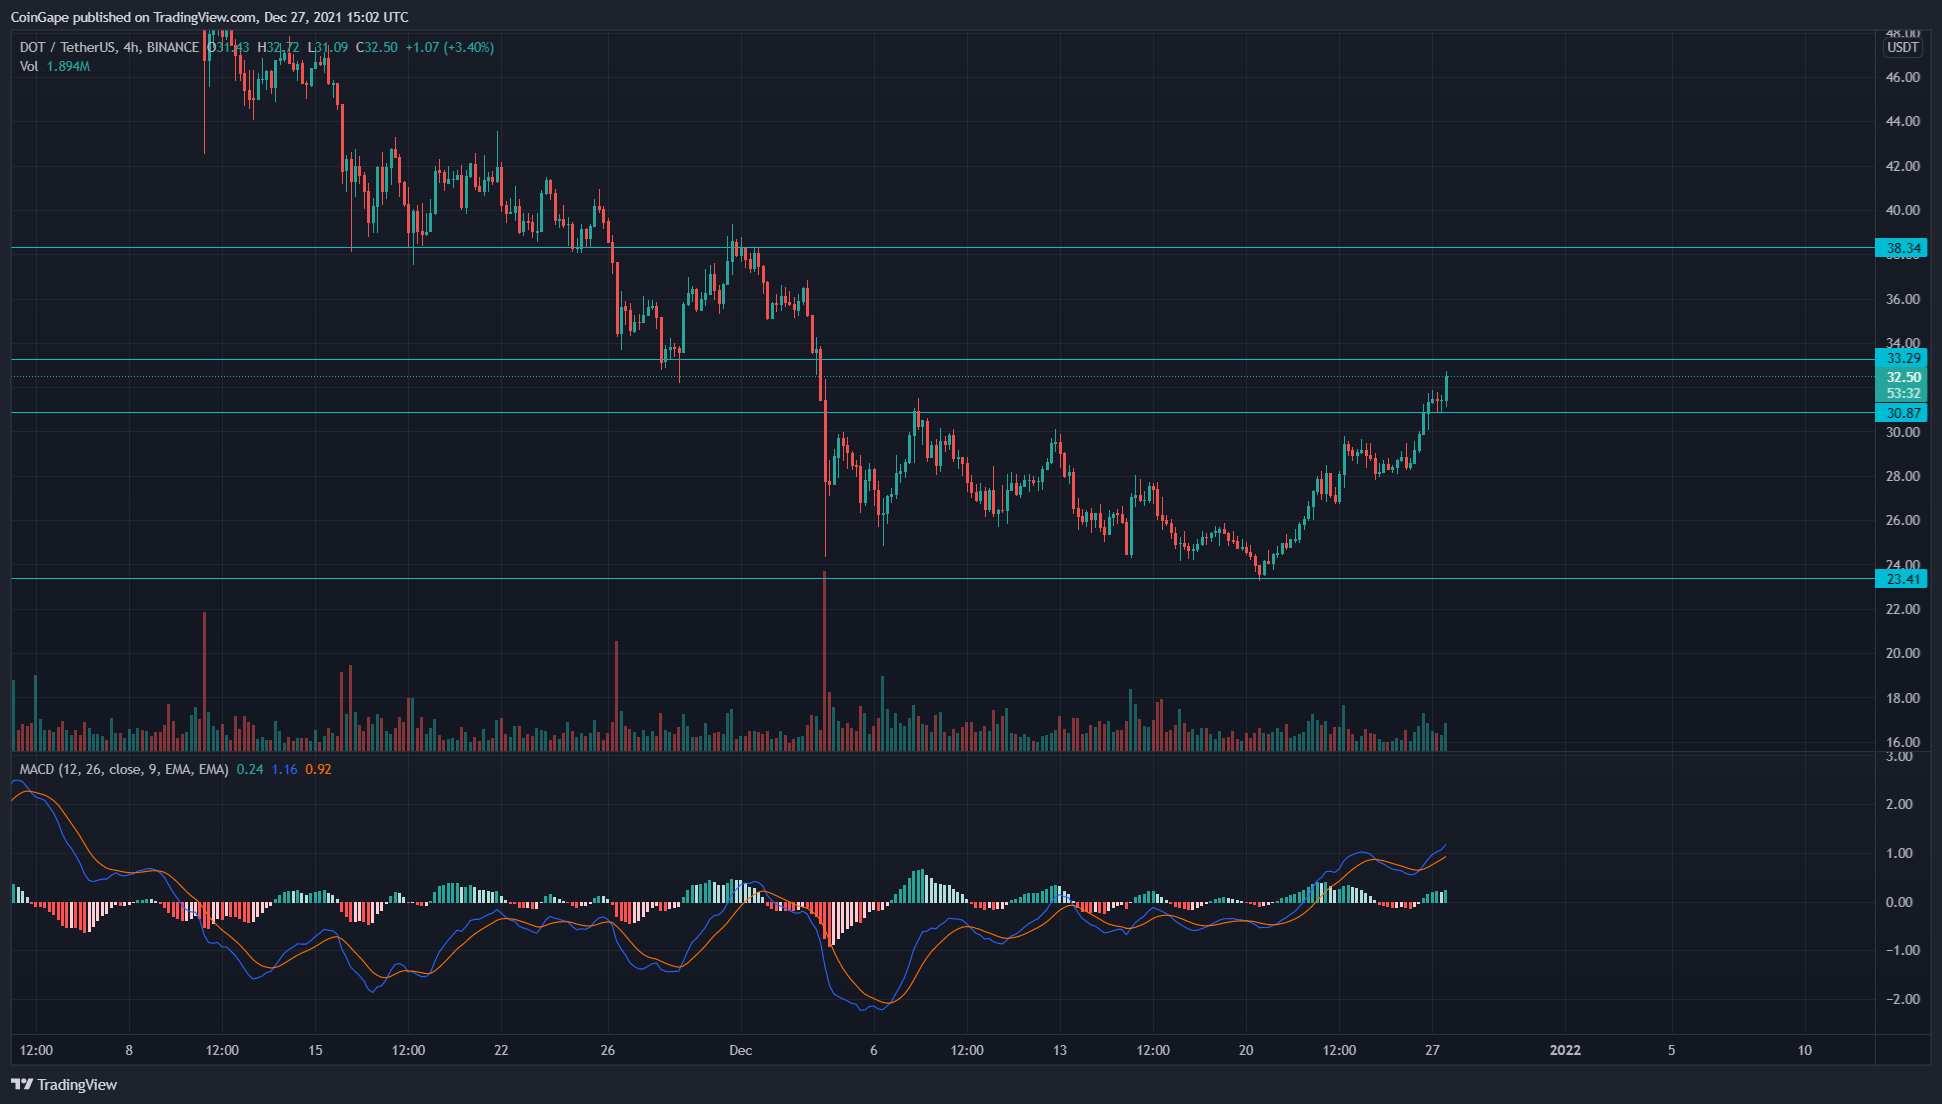 Source- Tradingview
On December 26th, the DOT coin price gave a bullish breakout from the $30.5 resistance level. After offering a decent retest phase, the coin shows a strong follow-up candle, displaying a 3% intraday gain. Anyhow, the next resistance level is quite near to the price, i.e., $33.3.
The crypto traders should look out for this resistance level, which can provide another long entry opportunity after a proper breakout.
The Moving average convergence divergence indicator shows MACD and the signal line moving above the neutral line projects a bullish momentum. Moreover, its chart also indicates a buy signal for the traders with a bullish crossover of these lines.

Why Trust CoinGape
CoinGape has covered the cryptocurrency industry since 2017, aiming to provide informative insights Read more… to our readers. Our journal analysts bring years of experience in market analysis and blockchain technology to ensure factual accuracy and balanced reporting. By following our Editorial Policy, our writers verify every source, fact-check each story, rely on reputable sources, and attribute quotes and media correctly. We also follow a rigorous Review Methodology when evaluating exchanges and tools. From emerging blockchain projects and coin launches to industry events and technical developments, we cover all facets of the digital asset space with unwavering commitment to timely, relevant information.
Delivered every day.
- Insights that move markets
- 100,000 active subscribers
Related Articles


- India’s Crypto Taxation Unchanged as the Existing 30% Tax Retains
- Crypto News: Strategy Bitcoin Underwater After 30% BTC Crash
- Expert Predicts Ethereum Crash Below $2K as Tom Lee’s BitMine ETH Unrealized Loss Hits $6B
- Bitcoin Falls Below $80K as Crypto Market Sees $2.5 Billion In Liquidations
- Top Reasons Why XRP Price Is Dropping Today
- Here’s Why MSTR Stock Price Could Explode in February 2026
- Bitcoin and XRP Price Prediction After U.S. Government Shuts Down
- Ethereum Price Prediction As Vitalik Withdraws ETH Worth $44M- Is a Crash to $2k ahead?
- Bitcoin Price Prediction as Trump Names Kevin Warsh as new Fed Reserve Chair
- XRP Price Outlook Ahead of Possible Government Shutdown
- Ethereum and XRP Price Prediction as Odds of Trump Attack on Iran Rise


