Price Analysis: Uniswap, Monero, And Helium Soar Again After A Period Of Rocky Trading


Uniswap, Monero, and Helium have been securing gains this week, however, these coins specifically lost their steam in the past few weeks but have now recovered again. Over the past week, these coins have gained more than 20% with chances of them appreciating further considering the readings of the near-term technicals.
In the last 24 hours UniSwap, Monero and Helium have gained substantially by more than 11%. The next vital trading levels for these coins have been discussed below.
UNI/USD Four Hour Chart

Uniswap had lost momentum in the past weeks but had also formed a double-bottom pattern, which ideally describes a reversal of the current price action. UNI regained its strength right after that and was trading at $19.66 at the time of writing.
The immediate resistance mark for the coin was at $22.91, while the support level for the coin stood at $18.82. Near term, the technicals have pointed towards bullish strength in the market.
The Relative Strength Index had drifted away from the midline, near the overbought territory with a surplus of buyers in the market. Awesome Oscillator displayed bullish sentiments with growing green histograms asserting the same.
MACD also underwent a bullish crossover and reflected a positive price action in the past trading sessions.
XMR/USD Four-Hour Chart
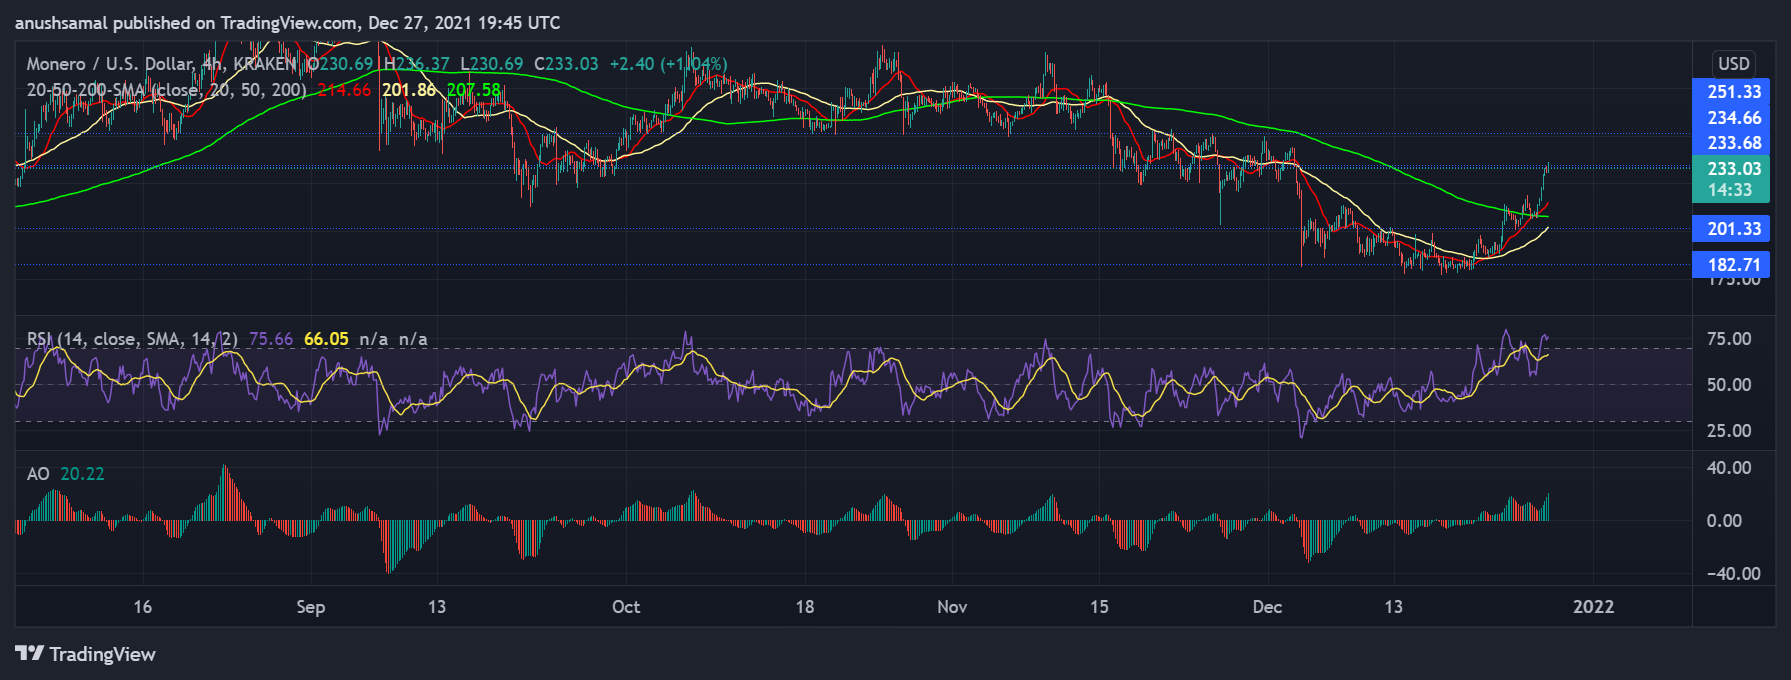
Monero had registered higher highs and was priced at $233.03, the immediate price level that the coin can attempt overcoming stood at $234.66.
The price of Monero was above the 200-SMA line which is indicative of an extreme bullish force in the market. On a price reversal, the coin can drop to its immediate support level of $201.33. If Monero keeps securing higher highs, the coin has the potential to secure about 8% gain.
The Relative Strength Index was above the 80-mark which signified an increase in buying strength. Over the past month and a half, the Relative Strength Index had struggled to move over the 80-mark.
Awesome Oscillator had depicted green signal bars and as the bullish pressure mounted, the green histograms grew in size.
HNT/USD Four-Hour Chart

Helium was trading for $41, the overhead resistance for the coin stood at the $45 mark. Over the past week, the coin surged by 28%. The support line stood at $40.92, a fall below that price level will make HNT trade close to the $35.33 price level.
The technicals indicated a massive bull run in the market as the price of the coin was seen above the 200-SMA line. Bollinger Bands opened up which meant that the coin could potentially encounter a rise in price volatility.
The Relative Strength Index had fallen from the overbought zone in the past few days, however, the indicator managed to sustain above the half-line as buying strength still dominated the market.

Why Trust CoinGape
CoinGape has covered the cryptocurrency industry since 2017, aiming to provide informative insights Read more… to our readers. Our journal analysts bring years of experience in market analysis and blockchain technology to ensure factual accuracy and balanced reporting. By following our Editorial Policy, our writers verify every source, fact-check each story, rely on reputable sources, and attribute quotes and media correctly. We also follow a rigorous Review Methodology when evaluating exchanges and tools. From emerging blockchain projects and coin launches to industry events and technical developments, we cover all facets of the digital asset space with unwavering commitment to timely, relevant information.

Delivered every day.
- Insights that move markets
- 100,000 active subscribers
Related Articles


- White House Proposes Stablecoin Rewards Compromise as CLARITY Act Odds Drop to 44%
- Trump’s Board Of Peace Eyes Dollar-Backed Stablecoin For Gaza Rebuild
- Trump’s World Liberty Financial Flags ‘Coordinated Attack’ as USD1 Stablecoin Briefly Depegs
- Trump Tariffs: U.S. Threatens Higher Tariffs After Supreme Court Ruling, BTC Price Falls
- Fed’s Chris Waller Says Support For March Rate Cut Will Depend On Jobs Report
- COIN Stock Risks Crashing to $100 as Odds of US Striking Iran Jump
- MSTR Stock Price Predictions As Michael Saylor’s Strategy Makes 100th BTC Purchase
- Top 3 Meme Coins Price Prediction As BTC Crashes Below $67k
- Top 4 Reasons Why Bitcoin Price Will Crash to $60k This Week
- COIN Stock Price Prediction: Will Coinbase Crash or Rally in Feb 2026?
- Shiba Inu Price Feb 2026: Will SHIB Rise Soon?


