


XMR Price Analysis: Falling Channel Leads The Short-Term Downtrend In Monero


The XMR/USD technical chart projects an overall sideways trend for this coin. The price resonates in a falling parallel channel pattern for its recent down rally. Though the pattern follows a downtrend, it also poses a possibility of initiating a bull rally.
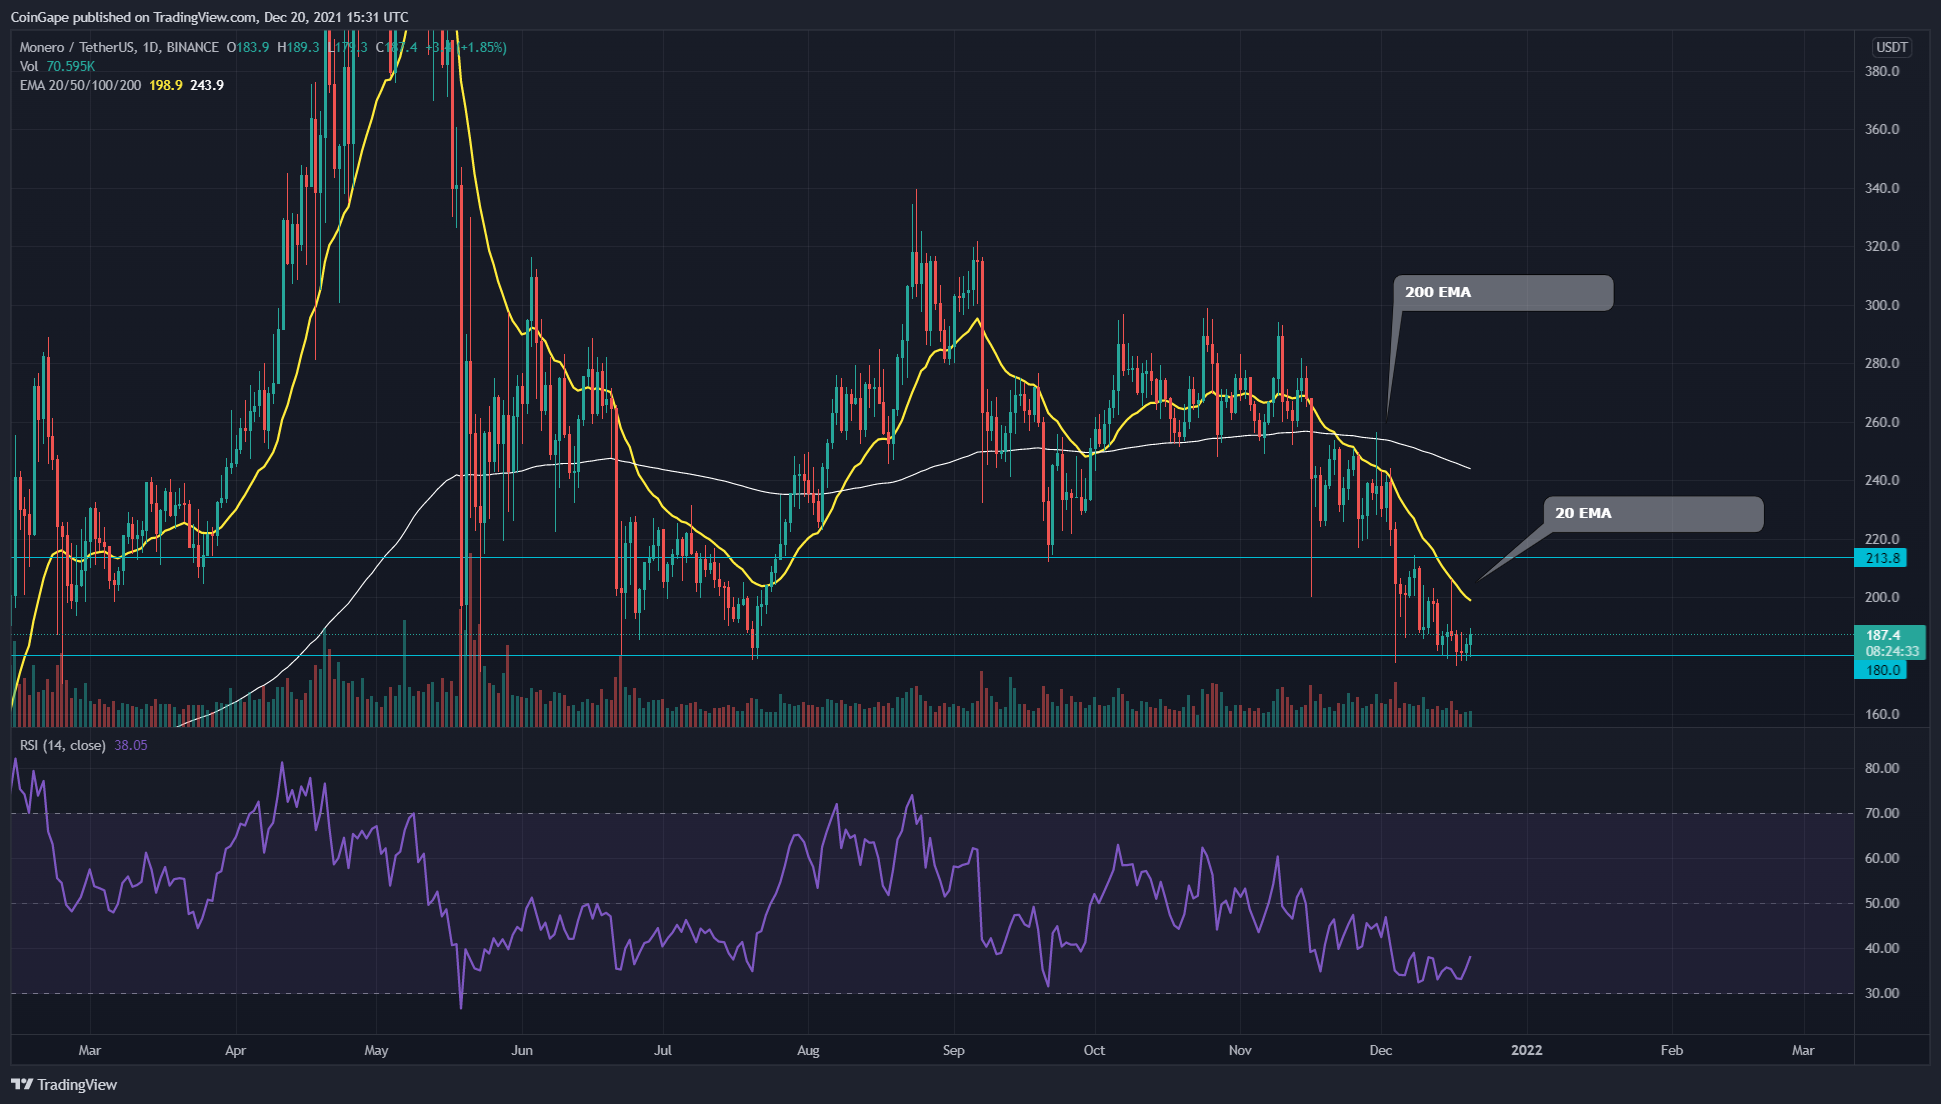
XMR/USD Daily Time Frame Chart
 Source- Tradingview
Past Performance or Trend
Since the crypto bloodbath of May ‘21, the XMR token has followed a sideways trend. The price action has been confined between the $340 and $180 mark for the last six months. After its latest rejection from the psychological level of $300, the price plunged back to the $180 support.
Bullish RSI Divergence Hints An Upcoming Rally In XMR Coin
For this short-term downtrend, the XMR coin has been resonating in a falling parallel channel. The pattern has led this red rally since the $300 mark and has brought it to the $180 crucial support. The coin will follow a downwards rally until this pattern is intact and potentially breach this bottom support.
On a contrary note, this type of pattern is quite known for a strong bullish rally when the price gives a proper breakout from the overhead resistance trendline. Therefore, the crypto trader should keep a sharp on this pattern as it provides an early signal and entry opportunities for a long trade.
By the time of writing this article, the XMR coin price is $187.2, with an intraday gain of 1.79%. The 24hr volume change is $166.7 Million, indicating a 60% hike. As per the Coinmarketcap, the coins stand at 44th rank with their current market cap of $3,370,104,416(+2.03).
XMR/USD 4-hour Time Frame Chart
 Source-Tradingview
Technical Indicators
- The daily Relative Strength Index (38) indicates a bearish sentiment for the token. However, the RSI has started projecting some positive signs in its chart.
- The XMR coin indicates a bearish alignment of the crucial EMAs (20, 50, 100, and 200). Moreover, the 20 EMA line provides dynamic resistance to the coin price.
- According to the pivot levels, coin traders could expect the closest resistance to the XMR price to be $189 then $200. For the reverse, the support levels are $172 and $159.6.
Why Trust CoinGape
CoinGape has covered the cryptocurrency industry since 2017, aiming to provide informative insights Read more… to our readers. Our journal analysts bring years of experience in market analysis and blockchain technology to ensure factual accuracy and balanced reporting. By following our Editorial Policy, our writers verify every source, fact-check each story, rely on reputable sources, and attribute quotes and media correctly. We also follow a rigorous Review Methodology when evaluating exchanges and tools. From emerging blockchain projects and coin launches to industry events and technical developments, we cover all facets of the digital asset space with unwavering commitment to timely, relevant information.


Delivered every day.
- Insights that move markets
- 100,000 active subscribers
Will Bitcoin reach $250,000 by December 31, 2026?


