Tezos Price Analysis: Emerging XTZ Coin Rally Eyes $5.8 Mark


The Tezos price maintains a short-term downtrend in its technical chart. This pair plummeted to the $3.85 support, bringing a 58% discount in its value. Furthermore, the price obtained sufficient demand pressure from below, followed by reversal signs from price action and indicators.
Tezos Key technical points:
- The XTZ coin shows a death crossover of the 50-and-200-day EMA
- The daily RSI chart crossed above the neutral zone(50)
- The intraday trading volume in the Tezos coin is $272.5 Million, indicating a 53.2% gain.
 Source- Tradingview
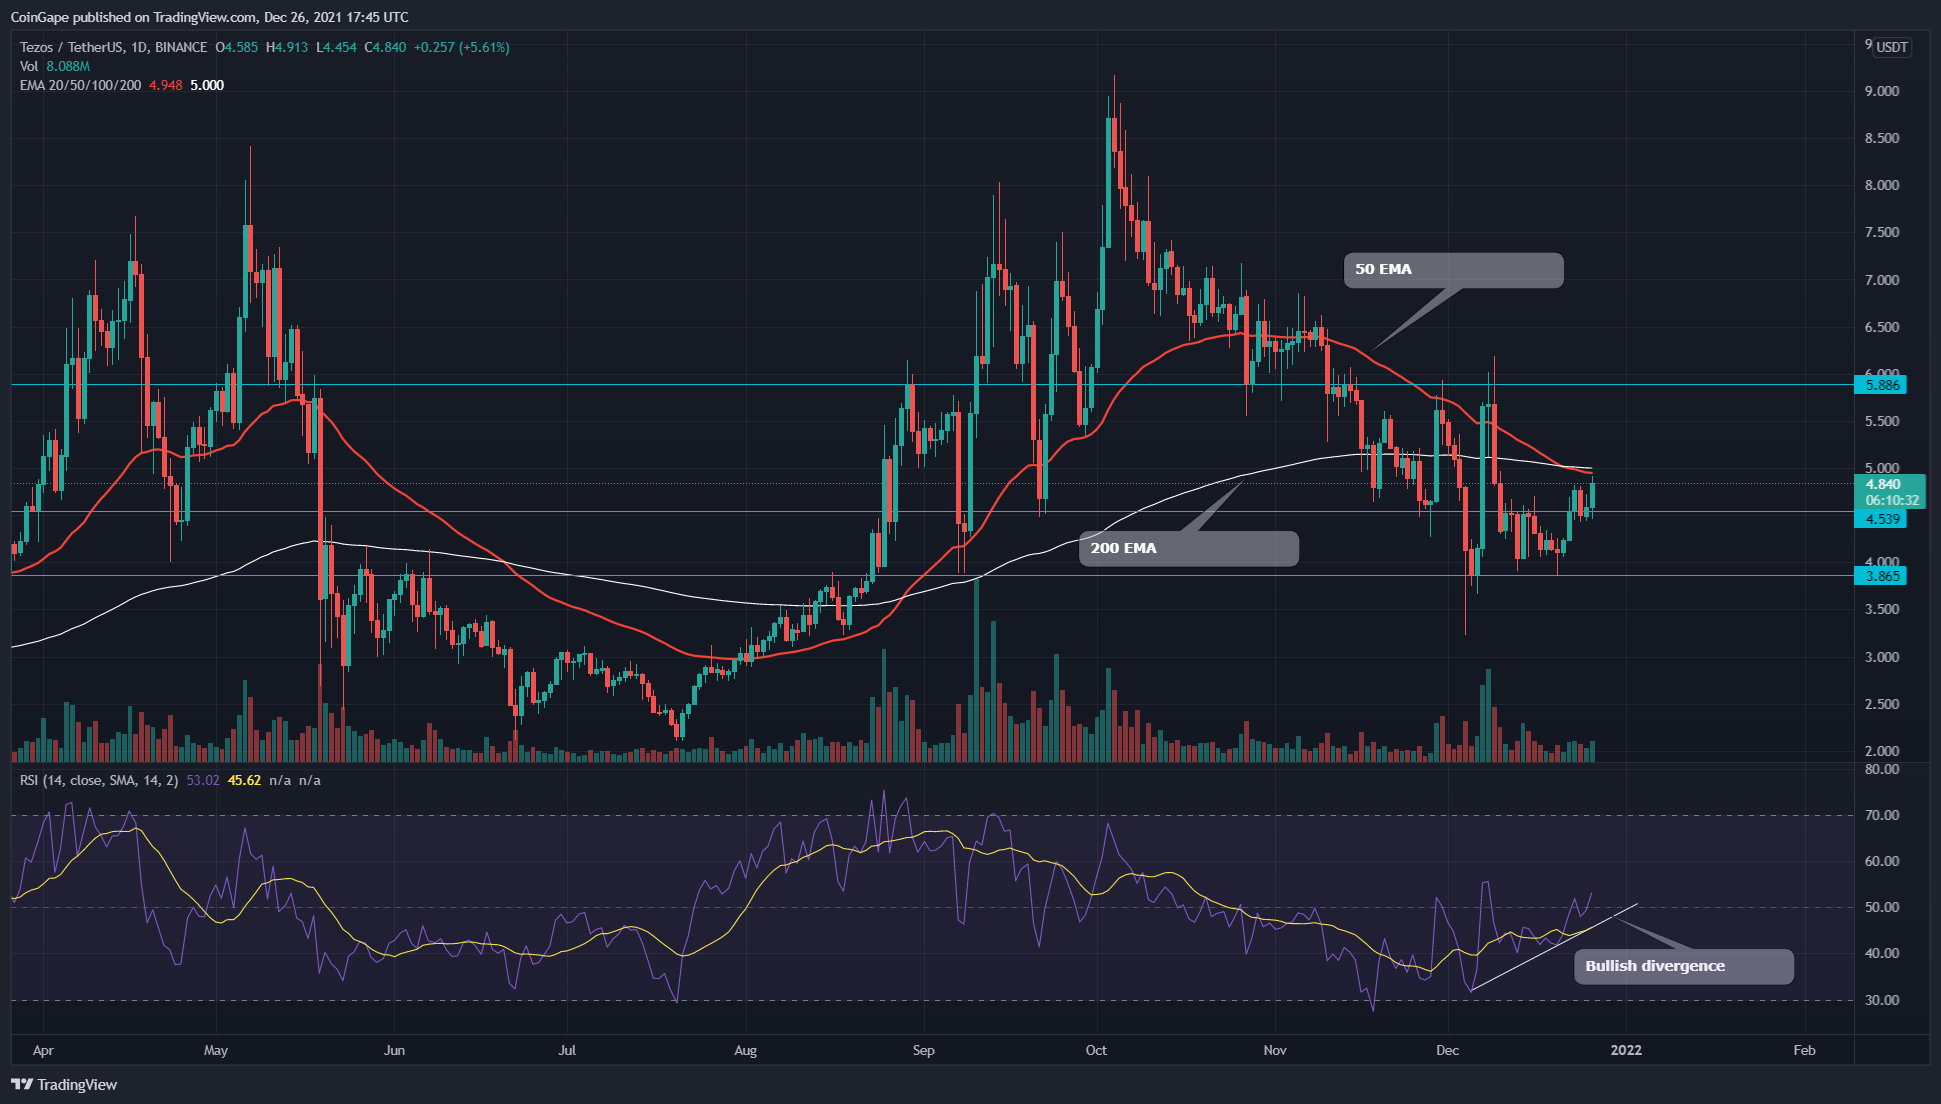
Previously when we covered an article on Tezos, the coin was trying to bounce back from the $3.8 support. However, the price could never breach the nearest resistance of $4.54, and after experiencing strong rejection from this level, it plunged back to the bottom support.
This pair resonated in this level for around two weeks before giving a proper breakout from the overhead resistance on December $23. The price sustains the retest phase the next day, and by forming a morning star candle pattern, it seems ready for an upward rally.
The crucial EMA levels(50, 100, and 200) still indicate a bearish trend for this token. Moreover, the chart has recently shown a death crossover of the 50 and 200 EMA.
The daily Relative Strength Index (62) indicates increasing bullishness in the price with its evident bullish divergence.
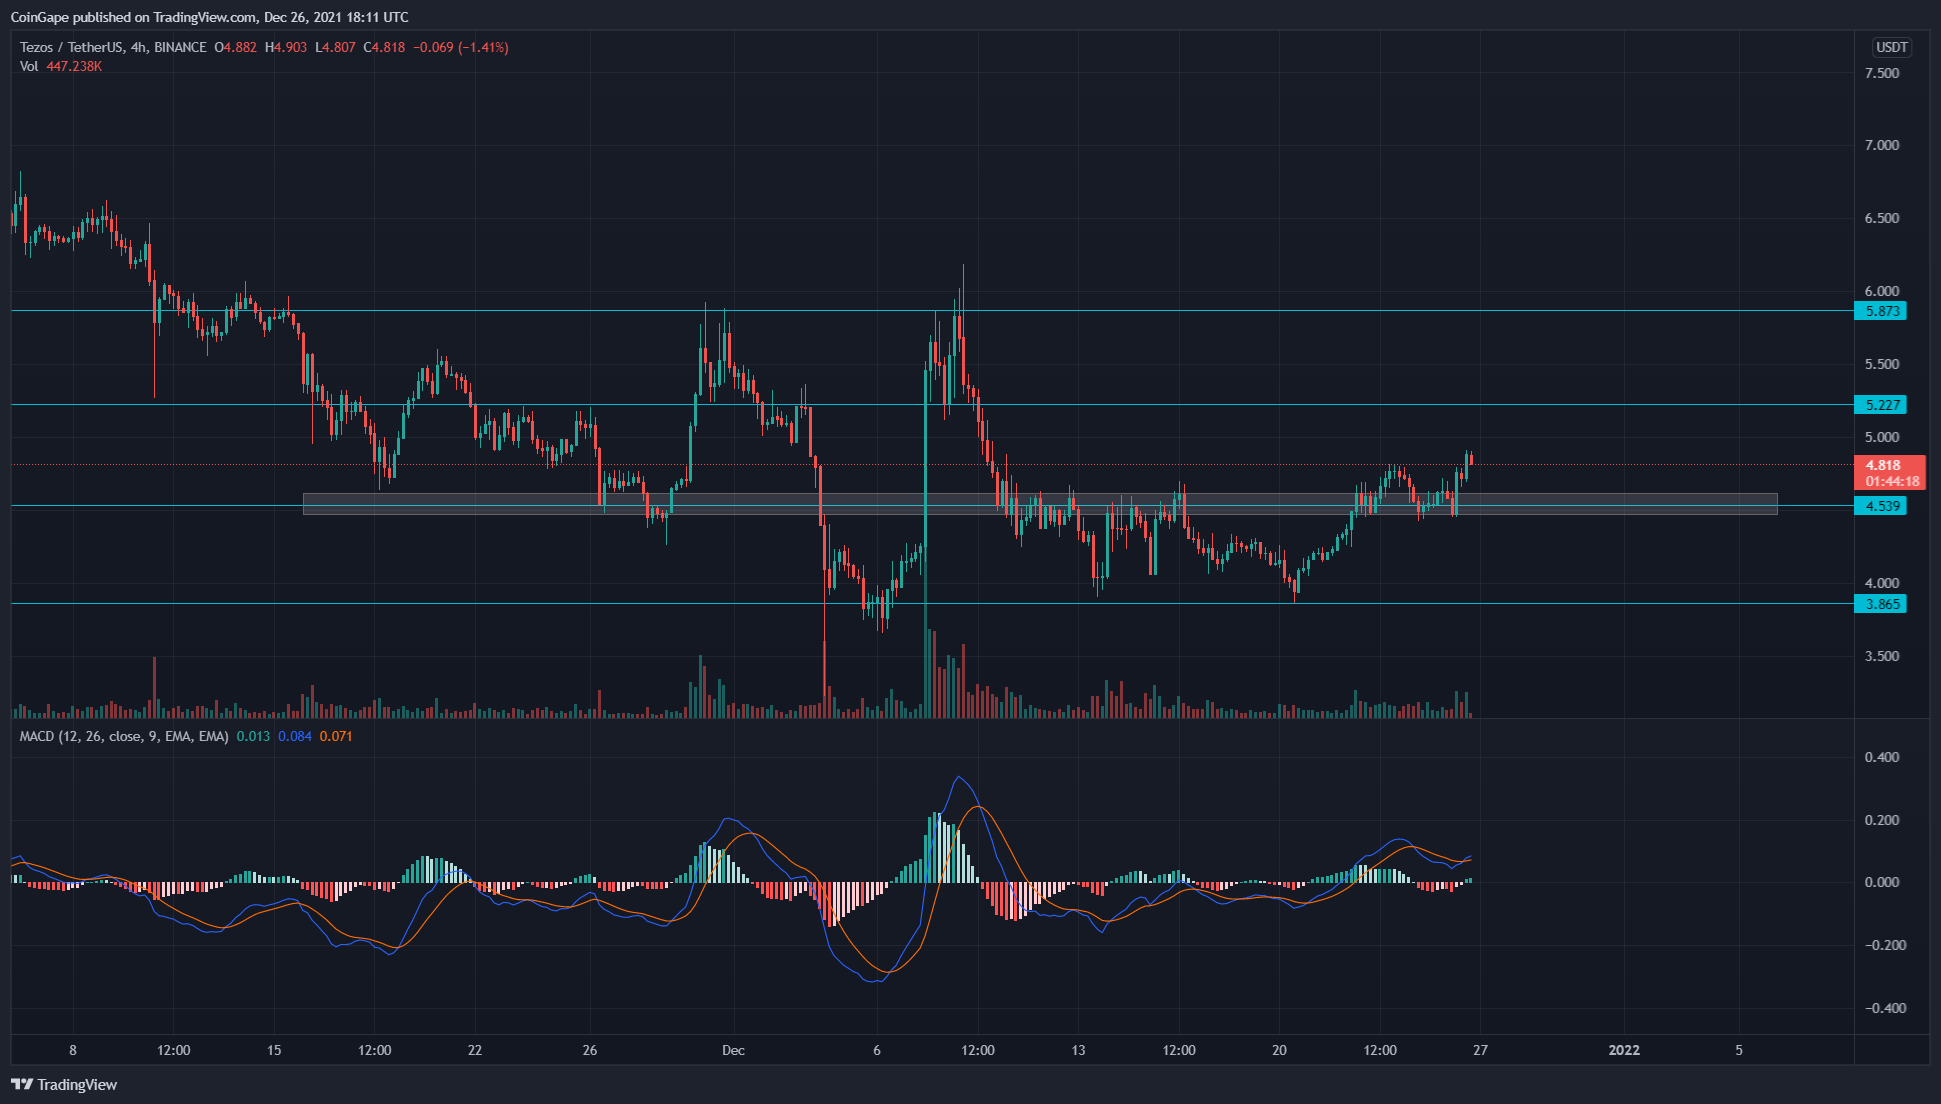
XTZ/USD 4-hour time frame chart
 Source- Tradingview
For Tezos coin to provide a better confirmation for a new rally, it needs to reclaim the crucial resistance of $5.8. The crypto traders can now expect good support from the $4.5 level, which will bolster the price to rally towards the above resistance.
However, a minor resistance level stands between $5.8, and the price is $5.2. The crypto traders should look out for this resistance as it can offer sufficient resistance to interrupt the new rally.
The Moving average convergence divergence shows both lines moving above the neutral line, indicating a positive outlook for the token. Moreover, the chart also shows a bullish crossover of these lines, indicating a buy signal.

Why Trust CoinGape
CoinGape has covered the cryptocurrency industry since 2017, aiming to provide informative insights Read more… to our readers. Our journal analysts bring years of experience in market analysis and blockchain technology to ensure factual accuracy and balanced reporting. By following our Editorial Policy, our writers verify every source, fact-check each story, rely on reputable sources, and attribute quotes and media correctly. We also follow a rigorous Review Methodology when evaluating exchanges and tools. From emerging blockchain projects and coin launches to industry events and technical developments, we cover all facets of the digital asset space with unwavering commitment to timely, relevant information.

Delivered every day.
- Insights that move markets
- 100,000 active subscribers
Related Articles


- Morgan Stanley, Other TradFi Load Up SOL as Solana RWA Tokenized Value Hits $1.66B ATH
- Trump’s WLFI Slides 8% as Senators Tell Bessent To Review World Liberty’s UAE Stake
- XRP Price Slides Under $1.5 Amid $50M Market Dump on Upbit
- Is Bitcoin Bottom Still Far Away as Matrixport Says More Bear Market Signals Are Emerging?
- Dalio’s Warning on World Order Sparks Fresh Bullish Outlook for Crypto Market
- XRP Price Prediction Ahead of Supreme Court Trump Tariff Ruling
- Crypto Price Prediction For This Week: Dogecoin, Solana and Cardano
- Bitcoin Price Prediction: How Could Brazil’s Strategic Bitcoin Reserve Proposal Impact BTC?
- 3 Top Reasons Pi Network Price Surging Today (14 Feb)
- XRP Price Prediction Ahead of Potential U.S. Government Shutdown Today
- Bitcoin Price Outlook As Gold And Silver Lose $3.6 Trillion in Market Value


