These DeFi Coins Have Retraced On their charts, here’s What Comes Next


Uniswap had seen bullish price action in the month of October which had then extended to even the mid of November. Ever since that, the coin has retraced and formed a bearish price pattern. At the current price level, Uniswap has been trading at a multi-month low price level. At the time of writing the coin was available for $14.47 and had registered a 7% fall over the last 24 hours.
UNI/USD Four-Hour Chart
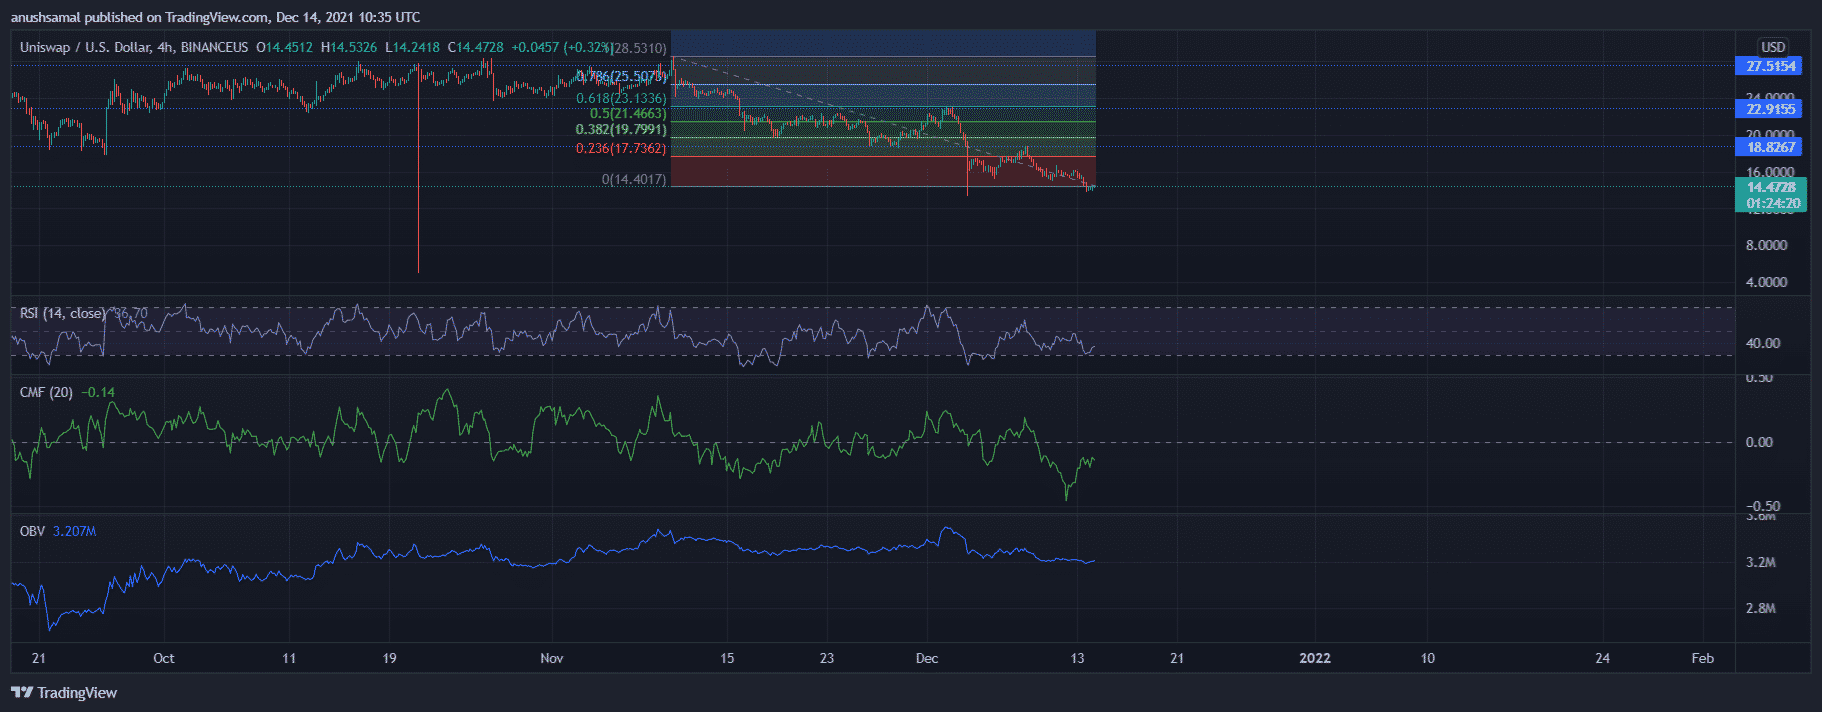
Although Uniswap had attempted to breach the bearish price movement, the coin encountered strong resistance at the 50% Fibonacci Level.
After being rejected at that level, the bulls had completely taken over the market. The immediate resistance mark stood at $18.82 and the local support rested at $14.39.
Buying strength remained low over the past few days as seen on the Relative Strength Index. Chaikin Money Flow also remained below the half-line which meant that capital outflows were more than capital inflows.
The On Balance Volume also confirms the same that selling pressure remained dominant in the market.
SUSHI/USD Four-Hour Chart
Sushiswap depreciated on its chart by 6.1% over the past day and was available for $5.63. From a look at the below chart, it is visible that Sushi was out of steam. The coin displayed a descending channel (in white) which meant that the token was on a downtrend.
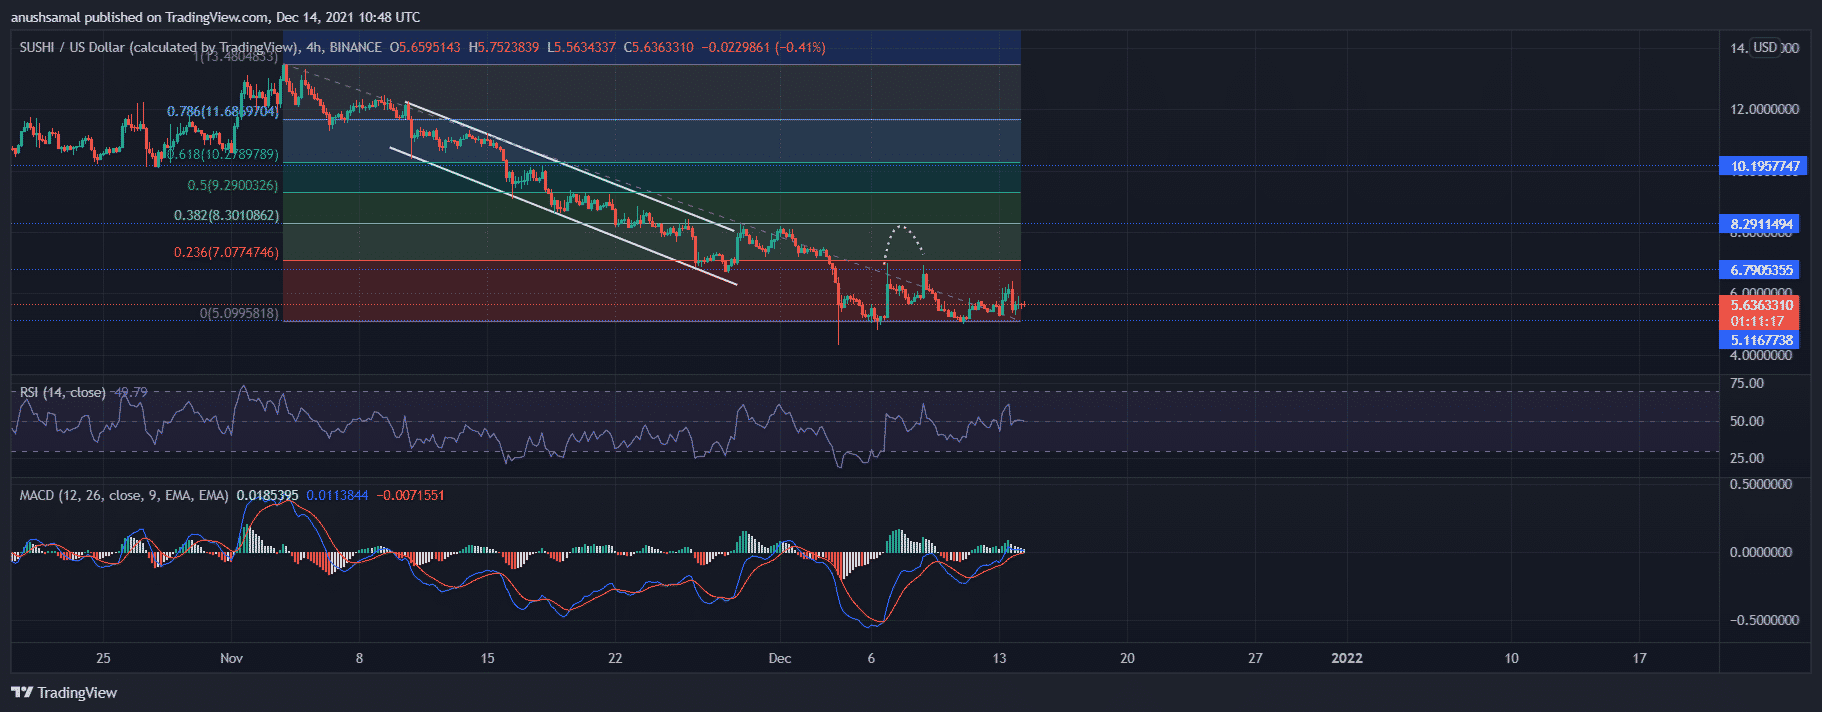
Sushiswap despite forming a double top on December 6, couldn’t hold onto the momentum anymore. The coin met with a sell-off and had resumed its bearish thesis. Sushiswap will have a hurdle moving past its 23.6% Fibonacci level. A fall below the current price level would mean the token would be priced at $5.11. Other resistance points stood at $8.29 and $10.19 respectively.
Selling pressure was more than the buying pressure as seen on the Relative Strength Index. MACD also indicated that the coin was headed towards a bearish crossover as the green histograms were declining.
COSMOS/USD Four-Hour Chart
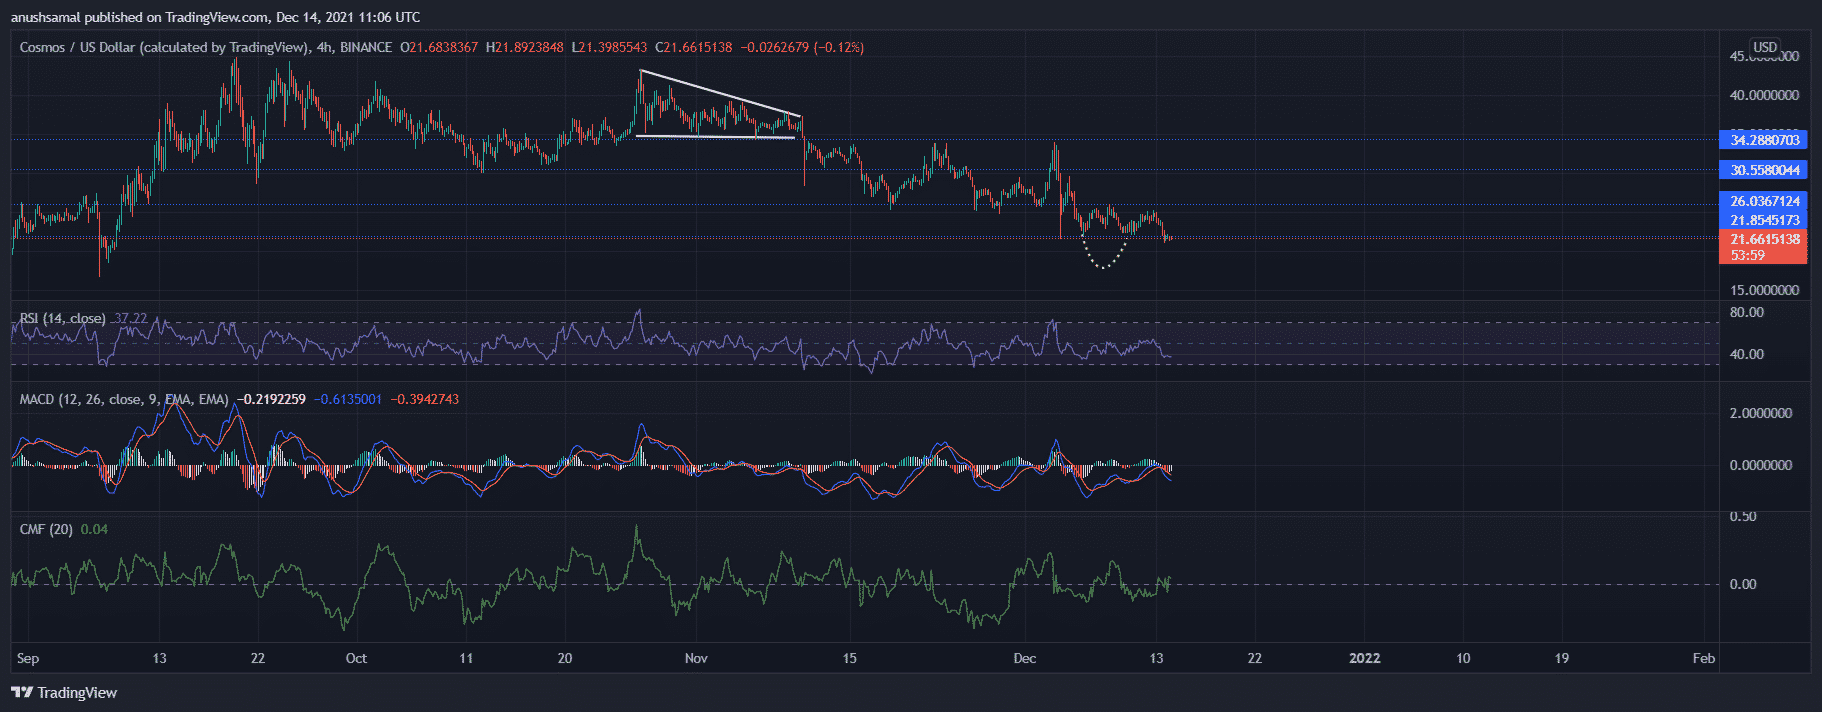
COSMOS was exchanging hands at $21.66 at a loss of 7.4% over the last day. Of late the coin recorded lower troughs, one after the other. As seen on the chart, the coin had formed a descending triangle, solidifying a continued downward price action. Over the last 72 hours, COSMOS displayed a double bottom, indicating intense selling pressure and prices dropping below the support line of $21.85.
Immediate resistance for the coin was at $26.03 and then at $30.55. The Relative Strength Index was below the half-line highlighting excess sellers in the market. MACD displayed bearish crossover and red histograms further validating a negative price action. On the flip side, Chaikin Money Flow pointed towards a recovery of capital inflows at the time of writing.

Why Trust CoinGape
CoinGape has covered the cryptocurrency industry since 2017, aiming to provide informative insights Read more… to our readers. Our journal analysts bring years of experience in market analysis and blockchain technology to ensure factual accuracy and balanced reporting. By following our Editorial Policy, our writers verify every source, fact-check each story, rely on reputable sources, and attribute quotes and media correctly. We also follow a rigorous Review Methodology when evaluating exchanges and tools. From emerging blockchain projects and coin launches to industry events and technical developments, we cover all facets of the digital asset space with unwavering commitment to timely, relevant information.

Delivered every day.
- Insights that move markets
- 100,000 active subscribers