Bitcoin, Ripple Price Analysis: July 19, 2021


- Bitcoin price dives under $30,000 for the first in July, sending the entire market on a tailspin.
- Ripple price goes back to the drawing board, testing lower levels at $0.52.
The cryptocurrency market is in red on Tuesday as traders usher in the European session. The Asian session was dominated by sellers, who seem to be on a mission to explore the rabbit holes. As discussed, Ethereum is back to trade slightly above $1,700 amid a push by the bears for losses to $1,600.
Bitcoin:-
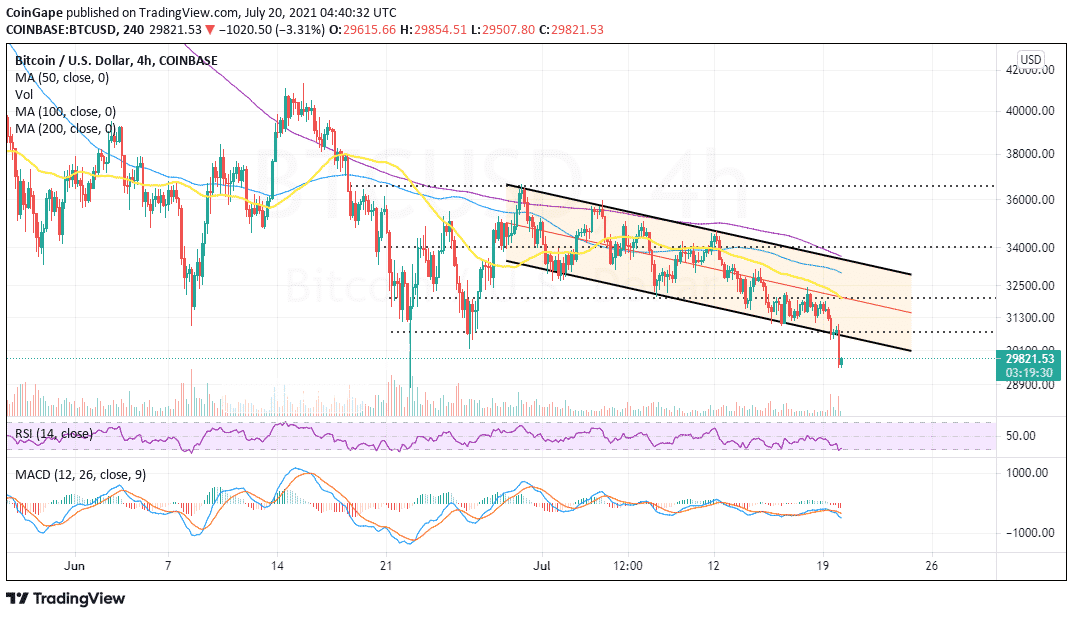
Bitcoin extended the bearish leg after losing support at $31,000. Massive sell orders were triggered, with $30,000 doing little to stop the losses.
At the time of writing, the flagship cryptocurrency is trading at $29,500, while bulls are working hard to ensure that declines do not stretch to say $28,000, a move that may wreak havoc as investors panicking shoots to higher levels.
All technical indicators show that Bitcoin’s least resistance path is downward. For instance, the Moving Average Convergence Divergence (MACD) hints at the breakdown continuing, especially after the recently confirmed sell signal.
The MACD technical tool is worth watching because traders can foresee the trend Bitcoin will take. Realize that support above $29,000 may allow bulls to increase their entries pulling BTC above $30,000. On the other hand, a daily close beneath $29,000 will stir another round of losses toward $28,000 and $25,000, respectively.
BTC/USD four-hour chart
Ripple:-
Ripple price is back on the drawing board after losing support at $0.55. Since last week, the general trend has been downward, especially after becoming astonishingly challenging to hold above $0.6.
A descending triangle pattern appears to have affirmed the downswing to $0.52. However, the triangle has a breakout target of 25% to $0.44. Therefore, support at $0.52 and, by extension, $0.5 must hold firmly to ensure that losses do not extend further.
Other technical levels remain drab, starting with the MACD, which continues to call investors to sell. The Relative Strength Index (RSI) dived into the oversold region, shining a light on the massive bearish outlook. If technical levels remain unchanged, Ripple will not have the willpower to recovery and may succumb to rising overhead pressure.
XRP/USD four-hour chart
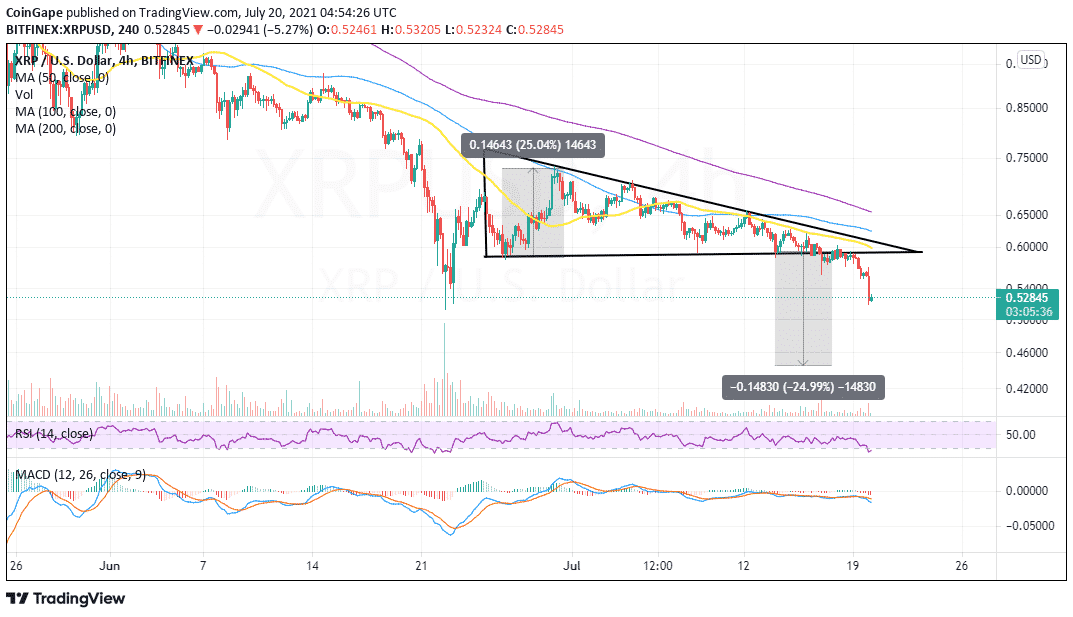
Since the RSI is in the oversold region in the four-hour timeframe, the bulls will likely take control in the short term. Holding support at $0.52 may also allow them to work toward the resumption of the uptrend.
Why Trust CoinGape
CoinGape has covered the cryptocurrency industry since 2017, aiming to provide informative insights Read more… to our readers. Our journal analysts bring years of experience in market analysis and blockchain technology to ensure factual accuracy and balanced reporting. By following our Editorial Policy, our writers verify every source, fact-check each story, rely on reputable sources, and attribute quotes and media correctly. We also follow a rigorous Review Methodology when evaluating exchanges and tools. From emerging blockchain projects and coin launches to industry events and technical developments, we cover all facets of the digital asset space with unwavering commitment to timely, relevant information.


Delivered every day.
- Insights that move markets
- 100,000 active subscribers