Cosmos Price Analysis: Buying Opportunity Before 2022 Bull Run In ATOM Coin


The Cosmos Price action shows a bull run in the daily chart and proposes a bullish breakout of a rounding bottom pattern in a shorter time frame. Therefore, traders can soon get an excellent buying opportunity before the end of 2021.
Cosmos Key technical points:
- The ATOM coin shows a bullish crossover of the 20-and-200-day EMA in the daily time frame
- The intraday trading volume in the Cosmos coin is $842.8 Million, indicating a 123.9% gain.
 Source- Tradingview
The last time when we covered an article on Cosmos on December 16th, the coin price was showing a bullish reversal with the breakout of $26 level. And since then, the breakout has increased the bullish trend momentum resulting in the uptrend continuation.
The coin price has breached the $30 mark and rises higher towards the next horizontal level. Moreover, the price action is making a bullish candle with lower price rejection in the daily chart.
Therefore, it seems that the ATOM coin price will showcase an uptrend for the next few days and might even break above the $35 mark. Moreover, the bullish crossover of the 20 and 200 EMA will accentuate the ongoing rally.
The daily Relative Strength Index (62) breaks above the SMA (14) and the neutral line(50) and continues to approach the overbought zone.
ATOM/USD 4-hour time frame chart
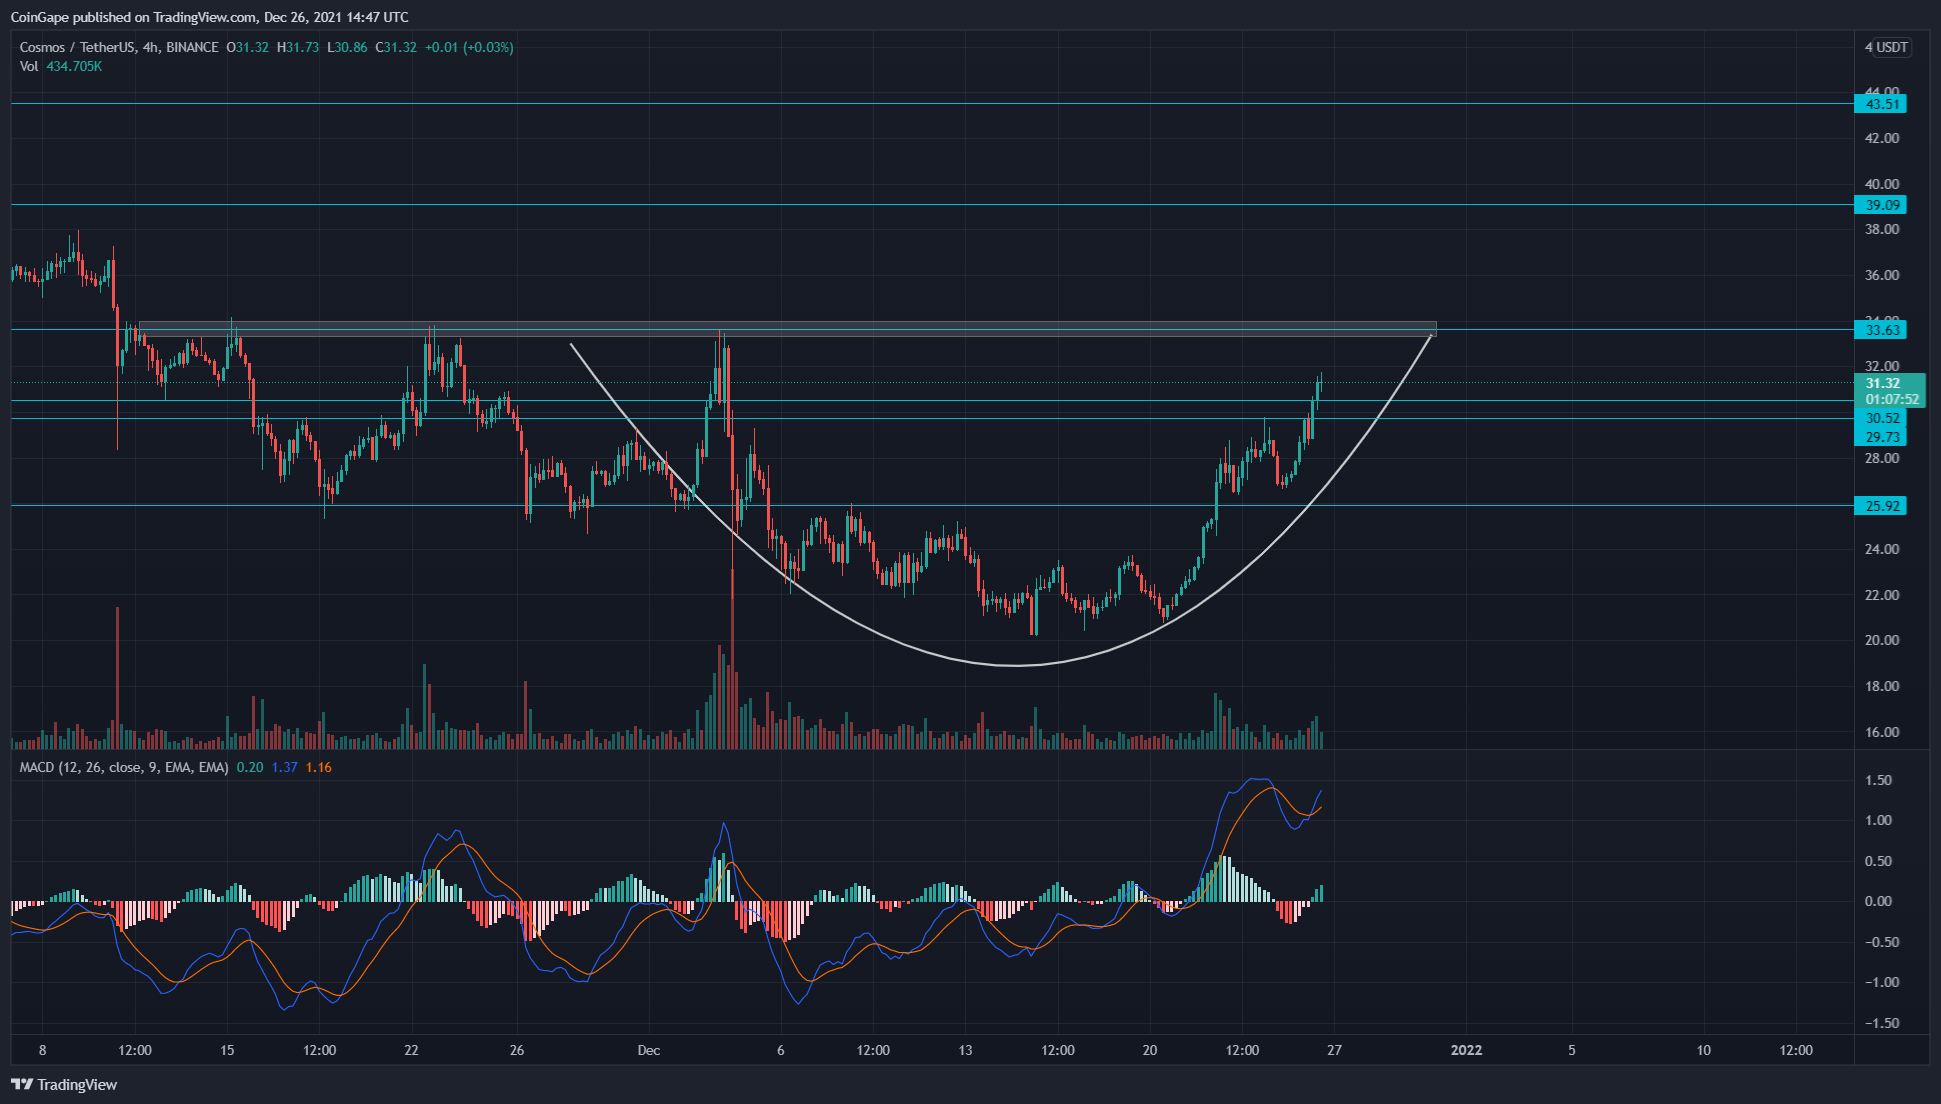 Source-Tradingview
The bullish reversal in the Cosmos coin price results in the formation of a rounding bottom pattern in the 4-hour chart. The neckline of the pattern is at the $33 mark, and the breakout of it will most likely drive the prices higher to the $40 mark.
However, the traders need to be careful in the short frame, as a few minor retracements within the pattern are possible. Therefore, traders need to be mindful of risk and quantity management.
The price action in the daily chart suggests the nearest resistance level for ATOM price is $40 and $44 after the $33 neckline. On the opposite end, the support levels are around the $30 mark and $26 level.

Why Trust CoinGape
CoinGape has covered the cryptocurrency industry since 2017, aiming to provide informative insights Read more… to our readers. Our journal analysts bring years of experience in market analysis and blockchain technology to ensure factual accuracy and balanced reporting. By following our Editorial Policy, our writers verify every source, fact-check each story, rely on reputable sources, and attribute quotes and media correctly. We also follow a rigorous Review Methodology when evaluating exchanges and tools. From emerging blockchain projects and coin launches to industry events and technical developments, we cover all facets of the digital asset space with unwavering commitment to timely, relevant information.

Delivered every day.
- Insights that move markets
- 100,000 active subscribers
Related Articles


- Saylor’s Strategy Hints at Bigger Bitcoin Buy Amid $5B Unrealized Losses
- Crypto Market Today: Pi, Pepe, DOGE, and XRP Post Double-Digit Gains
- Trump-Backed American Bitcoin Reserves Surpass 6,000 BTC, Now Worth $425.82M
- Expert Predicts Bitcoin Dip to $49K as ‘Trump Insider’ Whale Dumps 5,000 BTC
- Bitcoin Price Rebounds $70K, Here are the Top Reasons Why?
- Crypto Price Prediction For This Week: Dogecoin, Solana and Cardano
- Bitcoin Price Prediction: How Could Brazil’s Strategic Bitcoin Reserve Proposal Impact BTC?
- 3 Top Reasons Pi Network Price Surging Today (14 Feb)
- XRP Price Prediction Ahead of Potential U.S. Government Shutdown Today
- Bitcoin Price Outlook As Gold And Silver Lose $3.6 Trillion in Market Value
- XRP and Ethereum Price Prediction as Trump Seeks to Lower Key Tariffs


