Ethereum Price Analysis: Showing Bearish Outlook Below 228 USD


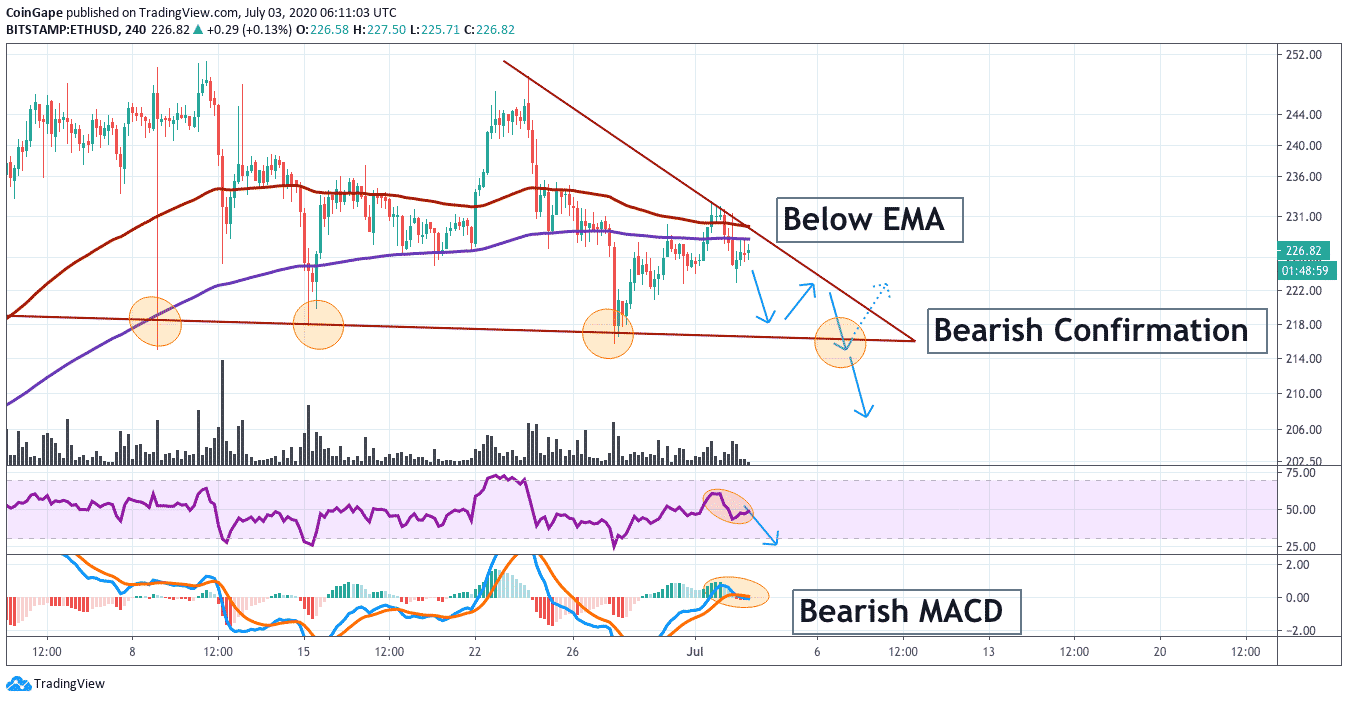
ETHUSD Is showing an overall bearish outlook currently below the important 200 and 100 EMA and with a bearish breakdown confirmed heavily to the downside which can continue when the bears hold this pace. Also ETHUSD is building a huge triangle formation which is a descending triangle that can break heavily to the downside when confirmed and showing the next steps in bearish continuation.
Etheruem Price Chart:
The RSI is sending moderate signs at the moment with more possible breakdowns to the downside and a touch of the oversold region possible which confirms below the 20 value.
The MACD sending an important sign which is a bearish crossover to the downside which is a serious sign in the MACD that is signaling the trend change to overall bearishness.
TREND: Downside
FORMATION: Descending triangle
EXPECTATION: Breakout
TREND AFTER EXPECTATION: More downside
PREV: 0.17657
OPEN: 0.17652
VOLUME: 66.318M
DAY’S RANGE: 0.17211 — 0.17760
Why Trust CoinGape
CoinGape has covered the cryptocurrency industry since 2017, aiming to provide informative insights Read more… to our readers. Our journal analysts bring years of experience in market analysis and blockchain technology to ensure factual accuracy and balanced reporting. By following our Editorial Policy, our writers verify every source, fact-check each story, rely on reputable sources, and attribute quotes and media correctly. We also follow a rigorous Review Methodology when evaluating exchanges and tools. From emerging blockchain projects and coin launches to industry events and technical developments, we cover all facets of the digital asset space with unwavering commitment to timely, relevant information.


Delivered every day.
- Insights that move markets
- 100,000 active subscribers
Will Bitcoin reach $250,000 by December 31, 2026?