Huobi Token, SushiSwap and Axie Infinity Price Analysis: 09 December


Huobi Group recently announced that their headquarters would operate out of Singapore right after the Chinese government imposed a crackdown on crypto trading. This development brought in changes in the token’s price action. At press time the token was priced at $9.93. Over the last 24 hours, HT recorded an 8.7% increase in prices, which could be tied to an increase in investments.
HT/USD Chart In The 4-hour Time Frame
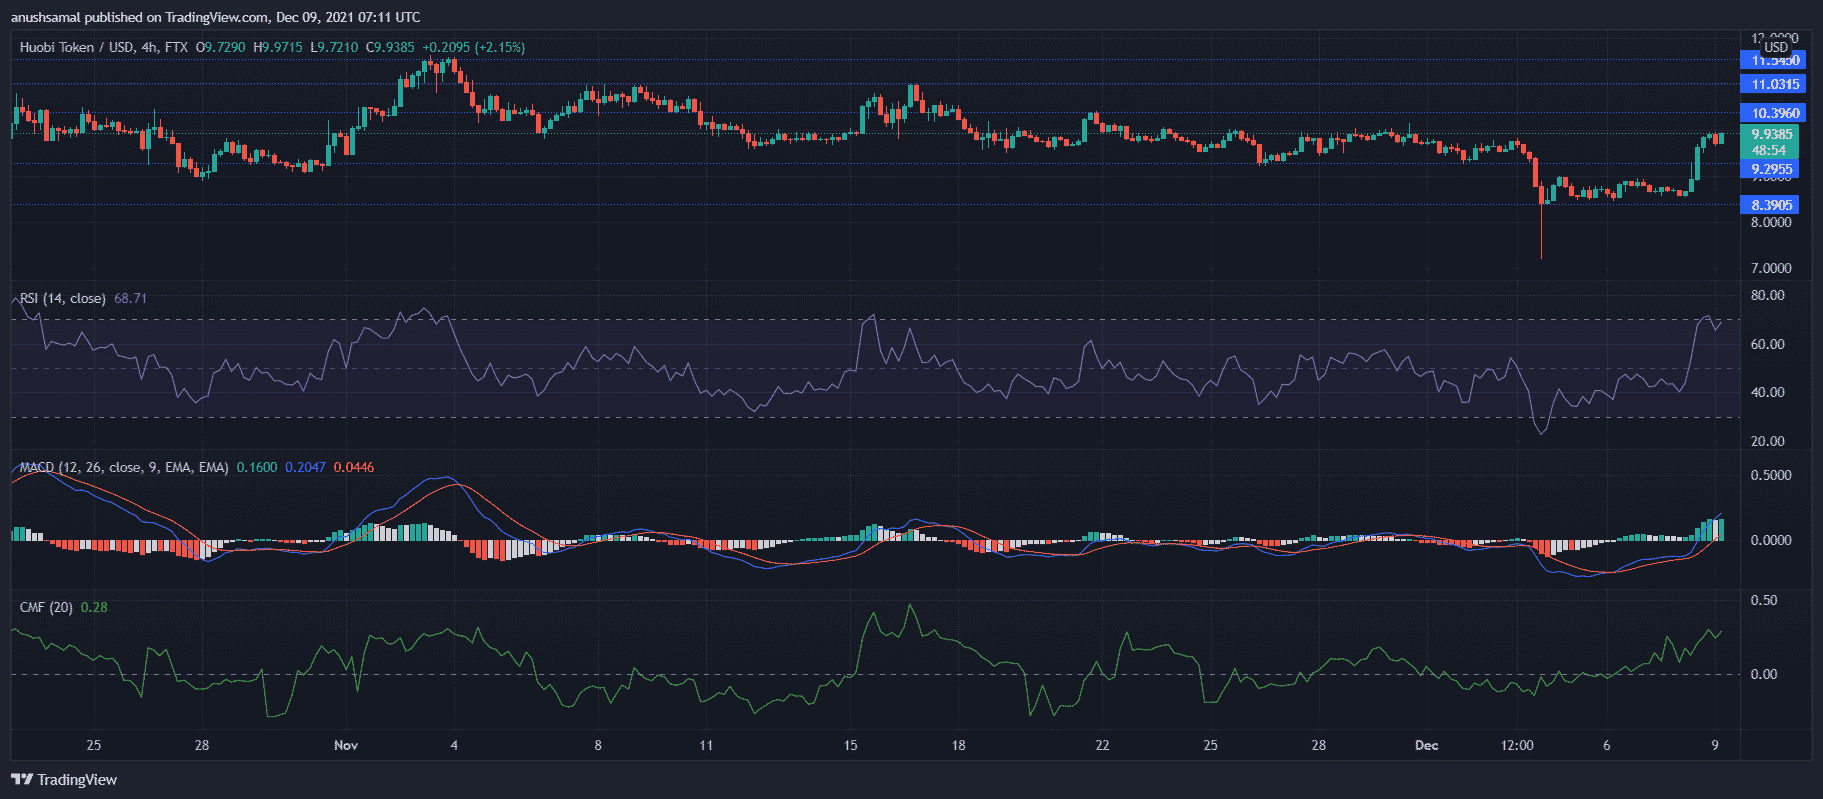
The immediate price ceiling for HT was at $10.39, the token was trading below that mark for the past few weeks. Technicals pointed towards an uptrend of prices. Buying strength was on a multi-week high for Huobi Token as seen on the Relative Strength Index. The indicator hovered near the 80-mark which signified that HT was overbought at the time of writing.
In case Huobi Token manages to break above the $10.39 resistance mark, the other price ceilings rested at $11.03 and $11.54. On the Chaikin Money Flow, capital inflows were more than capital outflows as institutional interest grew owing to the recent news about Huobi picking its headquarters.
MACD also encountered a bullish crossover and flashed green histograms. In the event of the buying pressure dropping, HT’s prices could move to trade near its support level of $9.29 and then at $8.39.
SUSHI/USD Chart In The 4-hour Time Frame
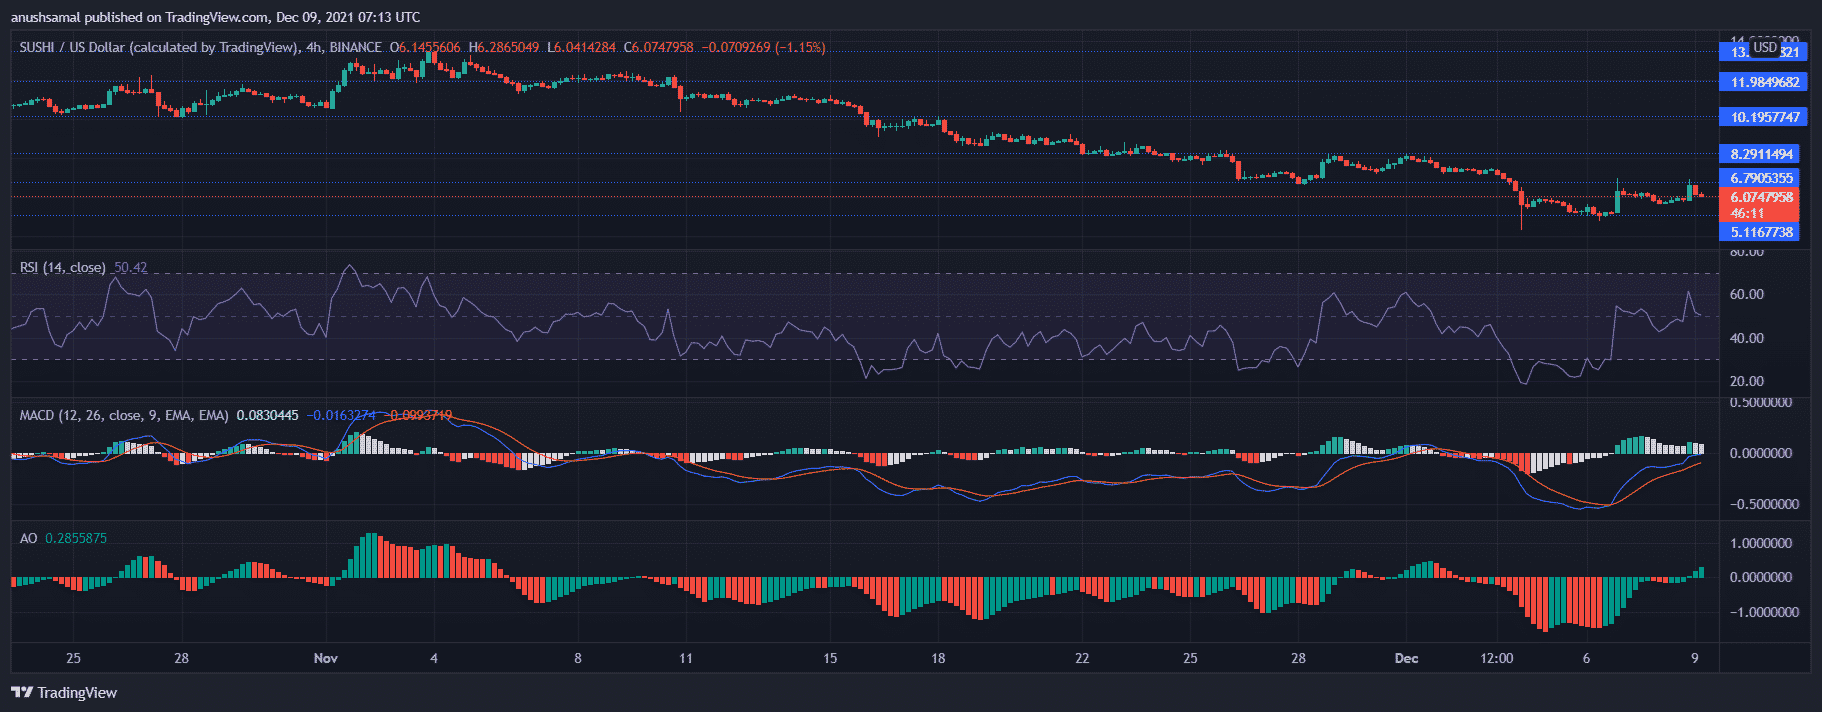
SushiSwap’s downtrend has remained consistent over the last couple of weeks, the altcoin lost almost 20.7% of its value in the last week. At press time, SUSHI was seen flashing signs of appreciation as the coin registered a 2% hike since the past day, it was priced at $6.07. The immediate support region for the coin was at $5.11.
MACD witnessed a bullish crossover and indicated some recovery over the last 24 hours. In accordance with the same, Awesome Oscillator also gave off green histograms.
Relative Strength Index although above the half-line, declined quite a bit, resulting in buyers exiting the market. If buying strength returns, SUSHI could attempt to breach the resistance mark of $6.79, moving past which SUSHI’s next target stood at $8.29. Additional price ceilings awaited the token at $10.19, $11.98 and $13.14.
In recent news, Joseph Delong, the Chief Technical Officer of SushiSwap resigned as a result of continuous friction and tension with the team.
AVAX/USD Chart In The 4-hour Time Frame
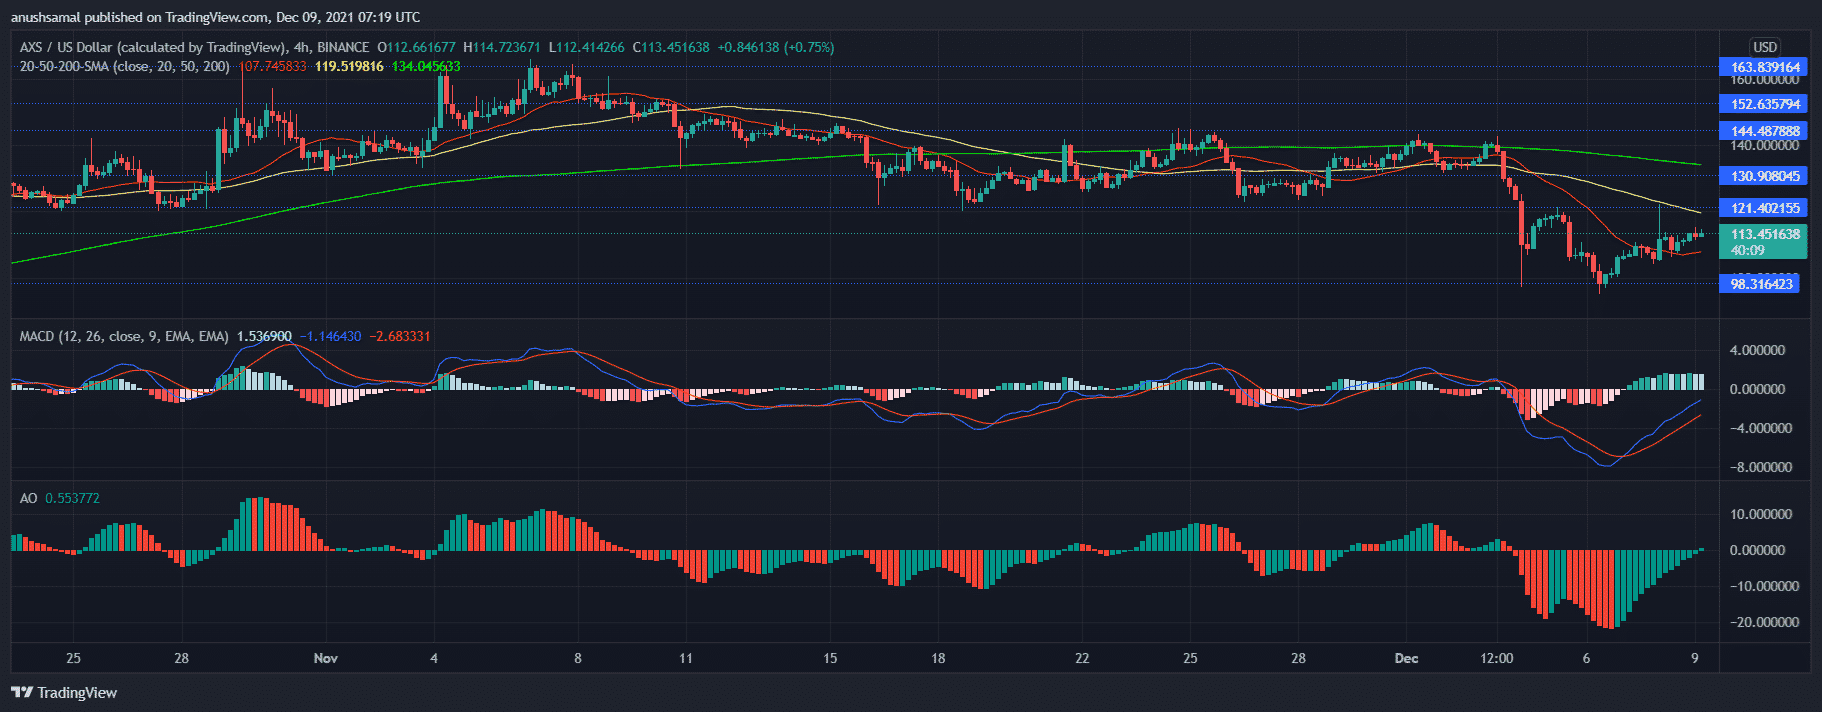
Following the December crash, Axie has made slow progress. Over the past day, Axie recorded a 2.7% gain. The coin was trading for $113.45, if the bullish reversal strengthens, AXS could aim for the immediate price ceiling of $121.40 and then trade near $130.90. Breaking above these levels could push AXS to hover around its long holding price ceiling of $144.48, a mark it hasn’t broken in the past few weeks now.
Technical outlook emanated bullish signals. On the four hour chart, the price of AXS was above the 20-SMA line which meant that price momentum was in favour of buyers.
Additionally, MACD also displayed a bullish crossover and a positive price movement. Awesome Oscillator’s green histograms were visible highlighting that AXS was moving upwards on its charts.
Why Trust CoinGape
CoinGape has covered the cryptocurrency industry since 2017, aiming to provide informative insights Read more… to our readers. Our journal analysts bring years of experience in market analysis and blockchain technology to ensure factual accuracy and balanced reporting. By following our Editorial Policy, our writers verify every source, fact-check each story, rely on reputable sources, and attribute quotes and media correctly. We also follow a rigorous Review Methodology when evaluating exchanges and tools. From emerging blockchain projects and coin launches to industry events and technical developments, we cover all facets of the digital asset space with unwavering commitment to timely, relevant information.


Delivered every day.
- Insights that move markets
- 100,000 active subscribers