


MATIC Price Analysis: Will $MATIC Revisit $0.52 Amidst Flat Market Conditions?


MATIC Price Analysis: After witnessing an aggressive bloodbath in early June, the MATIC price turned sideways and started coiling in a narrow range. The daily candles show short bodies and rejection wicks on either side, indicating no clear dominance from buyers or sellers. However, a closer look at the lower time frame chart shows the formation of a symmetrical triangle pattern. Amid the time of uncertainty, this pattern could give better clarity for a potential rally.
Also Read: Polygon 2.0 Released As the Value Layer of the Internet, MATIC Price Up 2.5%
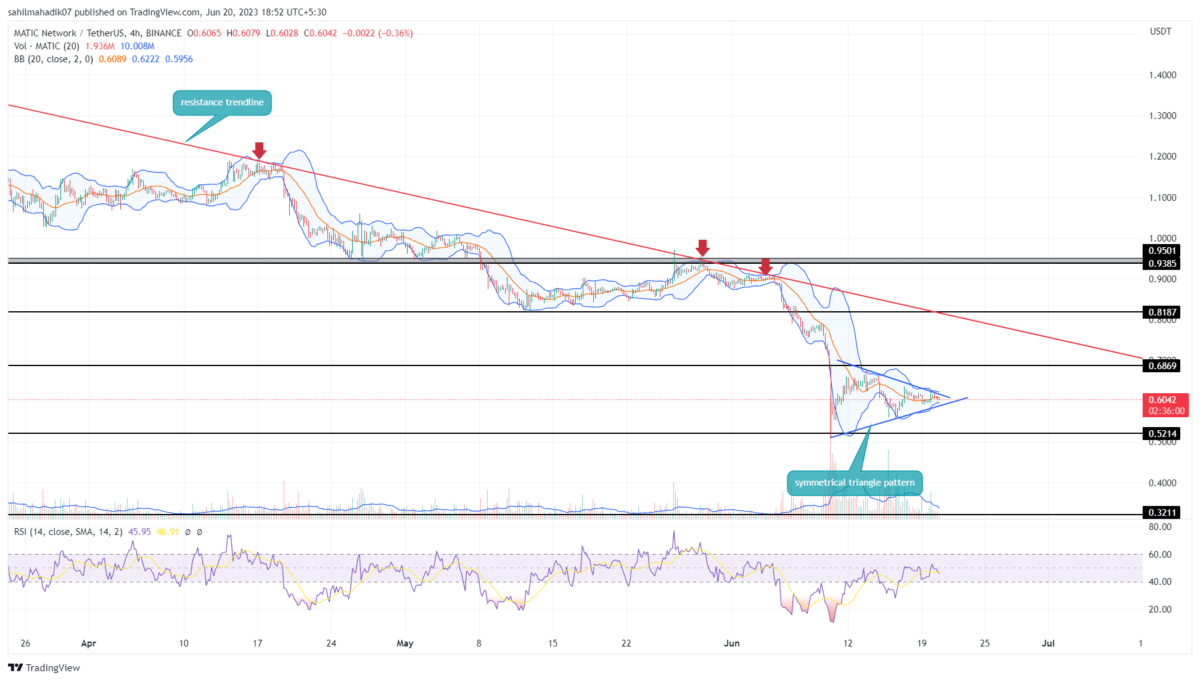
MATIC Price 4-Hour Chart
- A bullish breakout from the resistance trendline is needed to trigger a significant recovery.
- The $0.52 level stands as a strong demand zone for MATIC buyers
- The intraday trading volume in the MATIC is $226.5 Million, indicating a 4.57% gain.
 Source-Tradingview
The current uncertainty reflected in MATIC price is likely the conflict between the overall downtrend and buying pressure arising from discounted market value. As a result, the coin price has been moving sideways for over a week now.
However, this consolidation is restricted to two converging trendlines of a symmetrical triangle pattern. As of now, the polygon coin trades at $0.604 with an intraday loss of 1.5%.
This triangle pattern is known as a continuation pattern, and therefore, the prices are more likely to break the lower trendline to resume the prior downfall. A 4-hour candle closing below the trendline will replenish the selling pressure and may plunge 13% down to revisit $0.52 support.
Will MATIC Price Reclaim $0.8 Mark?
With a lesser possibility, the MATIC price can still break the resistance trendline of the triangle pattern and triggers a bullish upswing. This breakout could push the altcoin 22.5% higher before hitting the crucial resistance of the downsloping trend near $0.75. This trendline has been carrying the current downtrend in MATIC price, and therefore a breakout above it is needed to initiate a significant recovery above $0.8
- Bollinger Band: The bands of Bollinger Band squeeze accentuated the current indecisiveness in the market and therefore the need for a significant breakout to trigger a direction rally.
- Relative strength index: The growth in the RSI slope reflects the increase in bullish momentum and the possibility of a bullish recovery.
Why Trust CoinGape
CoinGape has covered the cryptocurrency industry since 2017, aiming to provide informative insights Read more…to our readers. Our journal analysts bring years of experience in market analysis and blockchain technology to ensure factual accuracy and balanced reporting. By following our Editorial Policy, our writers verify every source, fact-check each story, rely on reputable sources, and attribute quotes and media correctly. We also follow a rigorous Review Methodology when evaluating exchanges and tools. From emerging blockchain projects and coin launches to industry events and technical developments, we cover all facets of the digital asset space with unwavering commitment to timely, relevant information.


