Polkadot, VeChain Price Analysis: October 14, 2021


- Polkadot rallies nearly 20% to trade at $42 ahead of another upswing to all-time highs around $50.
- VeChain eyes $1.5, but first, the 200-day SMA barrier must come out the way.
The cryptocurrency market endured a healthy pullback mid-week, whereby Bitcoin retested support at $58,000. Investors did not waver but seem to have embraced the correction by taking more positions in the preferred digital assets. Bitcoin recovered, settling above $58,000 while Ethereum has lifted from $3,400 to beyond $3,600 at writing.
Some selected cryptocurrencies are trading higher with double-digit gains. Polkadot is up nearly 20% and exchanging at $42. Similarly, VeChain has accrued 10% in gains, brushing shoulders with $0.12. Most of the crypto assets are in green amidst the push to end the week in style.
Polkadot:-
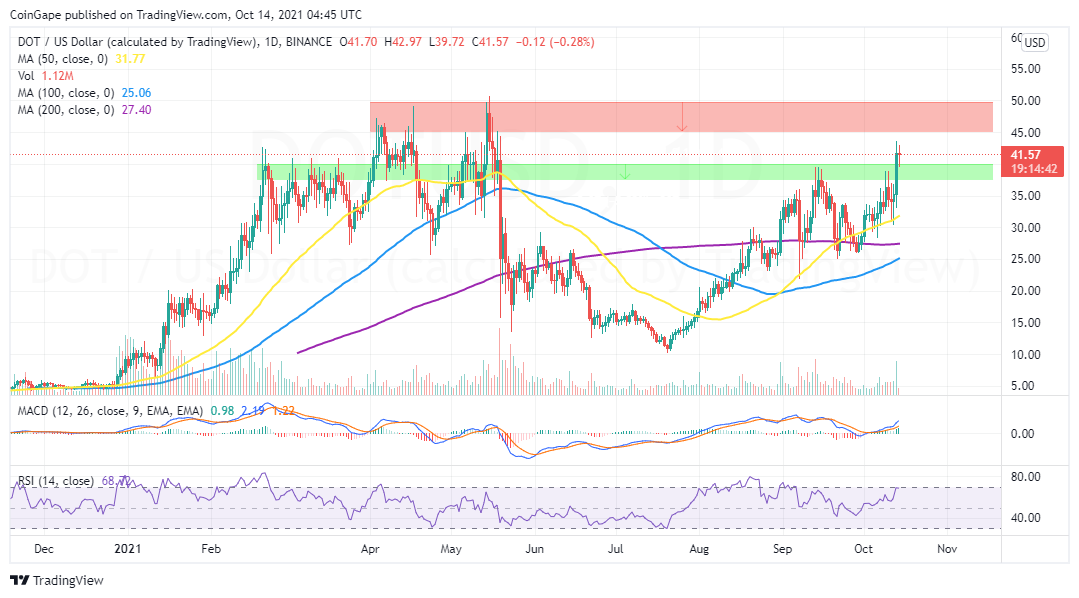
Polkadot is teetering at $42 after a massive breakout from levels close to $30 earlier in the week. The smart contracts token managed to flip a stubborn supply zone at $38 into support, a move that was a breath of fresh air to the uptrend.
DOT’s short-term technical picture is strongly bullish based on the Moving Average Convergence Divergence (MACD) and the Relative Strength Index (RSI). The former crossed above the mean line in addition to sustained buy signal while the latter is on the brink of entering the overbought region.
Higher support is required, preferably above $40. With the downside well-defended, bulls will comfortably focus on closing the gap to $50.
DOT/USD Daily Chart
VeChain:-
VET is on the verge of a colossal breakout at this juncture, which comes after the token secured support at $0.1 earlier this week. The presence of a 100-day SMA strengthened the buyer congestion zone.
At the time of writing, VeChain has lifted to $0.12. Buyers are focused on gaining more ground, with $0.15 coming into sight. The 200-day SMA caps the immediate upside and must come down to allow bulls to achieve the near-term goals.
VET/USD Daily Chart
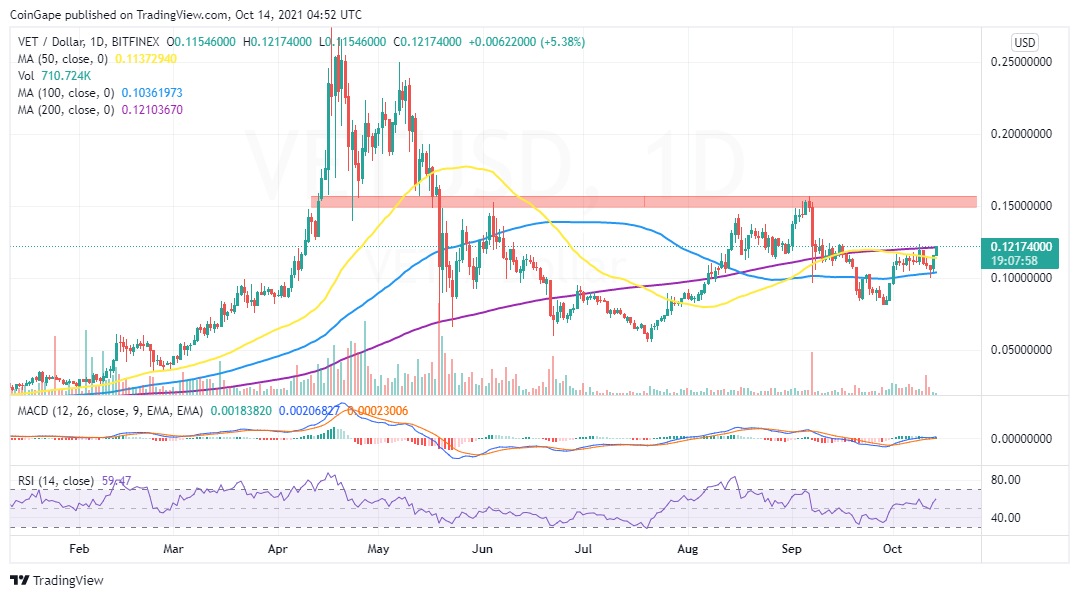
The uptrend appears to be in proper shape now that a buy signal comes into the picture as the MACD’s 12-day EMA crossed above the 26-day EMA. According to the RSI, buyers have the upper hand.
Instant Currency Exchange at BestChange with Ease
- Compare Rates Across 1000+ Exchanges
- Access 250+ Cryptocurrencies & Pairs
- Save Time with Real-Time Price Tracking

Why Trust CoinGape
CoinGape has covered the cryptocurrency industry since 2017, aiming to provide informative insights Read more… to our readers. Our journal analysts bring years of experience in market analysis and blockchain technology to ensure factual accuracy and balanced reporting. By following our Editorial Policy, our writers verify every source, fact-check each story, rely on reputable sources, and attribute quotes and media correctly. We also follow a rigorous Review Methodology when evaluating exchanges and tools. From emerging blockchain projects and coin launches to industry events and technical developments, we cover all facets of the digital asset space with unwavering commitment to timely, relevant information.


Delivered every day.
- Insights that move markets
- 100,000 active subscribers