Bitcoin Price Prediction: BTC Rolls Down The Runway Ahead Of Takeoff To $48,000


- Bitcoin bulls flex their muscle with a rebound from $40,000 to $44,000.
- A golden cross pattern in the daily chart hints at the uptrend achieving more than just listing to $48,000.
Bitcoin bulls fought tooth and nail to defend the support at $40,000 earlier this week. The largest cryptocurrency has initially corrected from highs close to $49,000 amid instability in the global stock market.
As recovery begins, investors are lining up to take positions. Speculation is bound to increase for gains above $48,000 and to $50,000. Ethereum has posted considerable single-digit gains in the last 24 hours and is trading slightly above $3,000. Other altcoins performing incredibly well include Ripple (up 10%), Solana (up 12%), and Polkadot (up 14%). At the time of writing, BTC/USDT rate is $43,940.
Bitcoin Price Closes The Gap To $44,000
The support at $40,000 is a strong demand zone, marked in a green band on the chart. It was reinforced by the 100-day Simple Moving Average (SMA), which played a vital role in the ongoing upswing.
The largest cryptocurrency is trading at $43,850 as it closes the gap to $44,000. A daily close above this immediate barrier would validate another breakout past $45,000.
Investors should be aware of the delays likely to challenge the trip to the supply zone marked in red around $48,000. The 200-day SMA and the 50-day SMA could be hosting addresses that may want to break even as Bitcoin rises. If selling pressure increases significantly, the uptrend will slow down or halted altogether.
It is essential to realize the 50-day SMA recently crossed above the 200-day SMA, forming a golden cross pattern. Many prominent analysts regard this index as a formidable chart pattern likely to enforce an uptrend, and sometimes it marks the beginning of a bull run.
The last time a golden cross occurred was in May 2020. Its appearance was a turning point and led to the incredible bull run to $20,000 by December. Bitcoin kept the rally going, later accomplishing a new all-time high of around $64,000.
BTC/USD Daily Chart
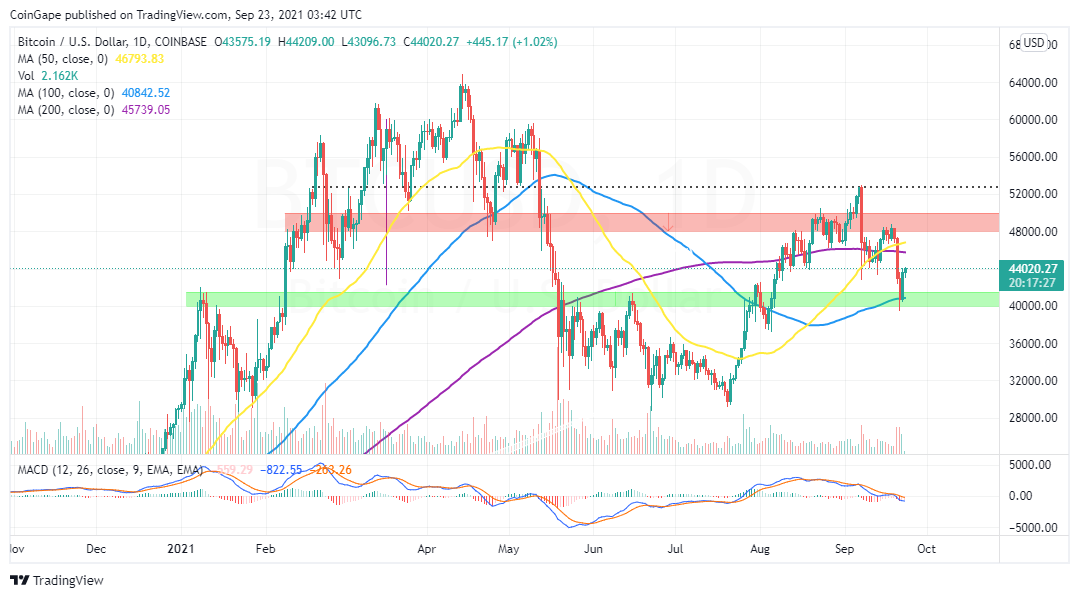
On the other hand, buyers should proceed with caution, remembering that the MACD is still bearish on the daily chart. The 12-day EMA must cross above the 26-day EMA to ascertain the uptrend in the coming session or days.
Bitcoin Intraday Levels
Spot rate: $44,033
Trend: Bullish
Volatility: Low
Support: The 100 SMA and $40,000
Resistance: $46,000 and $48,000
Why Trust CoinGape
CoinGape has covered the cryptocurrency industry since 2017, aiming to provide informative insights Read more… to our readers. Our journal analysts bring years of experience in market analysis and blockchain technology to ensure factual accuracy and balanced reporting. By following our Editorial Policy, our writers verify every source, fact-check each story, rely on reputable sources, and attribute quotes and media correctly. We also follow a rigorous Review Methodology when evaluating exchanges and tools. From emerging blockchain projects and coin launches to industry events and technical developments, we cover all facets of the digital asset space with unwavering commitment to timely, relevant information.


Delivered every day.
- Insights that move markets
- 100,000 active subscribers
Will Bitcoin reach $250,000 by December 31, 2026?