


Bitcoin And Ethereum Sell Off Nearing An End- CNBC Host Jim Cramer


According to CNBC’s famous host Jim Cramer indicates that current ongoing sell-off in the world’s two significant cryptocurrencies might be nearing an end, citing research from experienced expert Tom DeMark.
According to Coin Metrics, Bitcoin hit its lowest point since July on Monday, falling to $32,982.11 per token. During the trading day, however, bitcoin reversed course and climbed to around $36,000. The cryptocurrency is still a long way from its all-time high of nearly $69,000 set in the fall.
Ether also fell to its lowest level since July on Monday, reaching $2,176.41 before recouping some of those losses, according to Coin Metrics. It is almost 50% lower than its all-time high. It fall down to the price lower than the usual.
Is There More Pain to Follow?
While there is a chance that bitcoin’s current rapid decrease may inflict actual harm to the cryptocurrency, Cramer said DeMark is wagering that will not happen — just as bitcoin’s nearly 56 percent slide from April to June 2021 did not prevent it from establishing new highs in the autumn.
Indeed, DeMark points out that bitcoin’s current drop angle is equal to Cramer’s 2021 plummet. “In other words, history has a high probability of repeating itself.”
Cramer said that bitcoin is now at No. 11 on DeMark’s well-known 13-session countdown pattern, which the expert analyses to determine whether a rally or downturn has reached its conclusion.
“Two more negative closes are required before his buy trigger fires,” Cramer said, adding that DeMark would like to see bitcoin test his downside price objectives.
“If Monday’s afternoon reversal is simply a transitory rebound,” Cramer said, “DeMark wouldn’t be surprised to see bitcoin hit with a two- or three-day panic selling climax, which could take it all the way down to 26,355.”
Key Metrics to Watch Out
Though there are many metrics and technical charts to analyze Bitcoin price, rising co-relation of crypto to S&P500 index is definitely worth keeping an eye. Macro economic factors like rising interest rates and Fed’s rising hawkish sentiment is also playing a key role in deciding Crypto price.
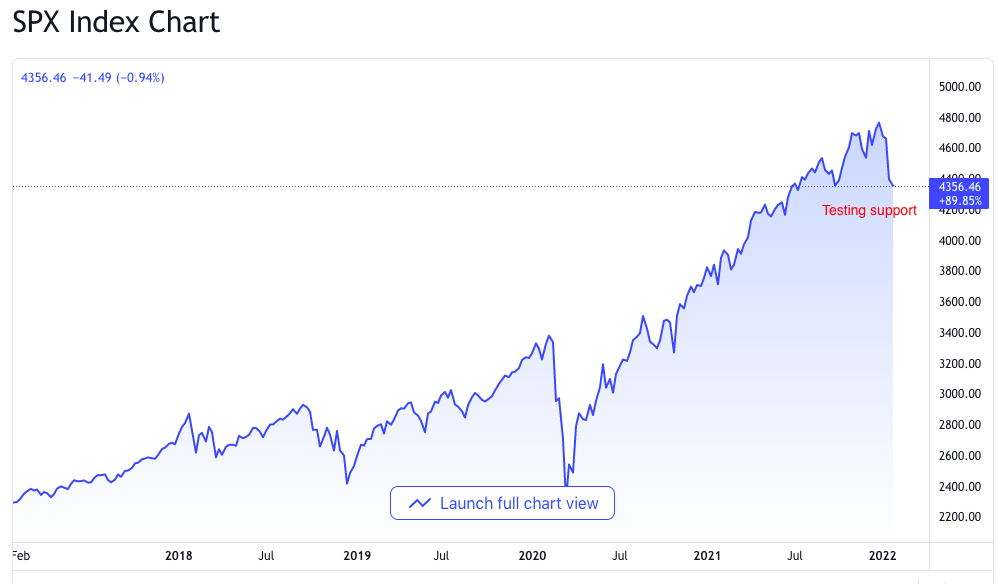
Source: Tradingview
Investors look for non-correlated assets in their portfolio and rising crypto & equity stocks co-relation is not good for overall crypto market. This defeats the purpose of crypto as a hedge in uncertain times like now.
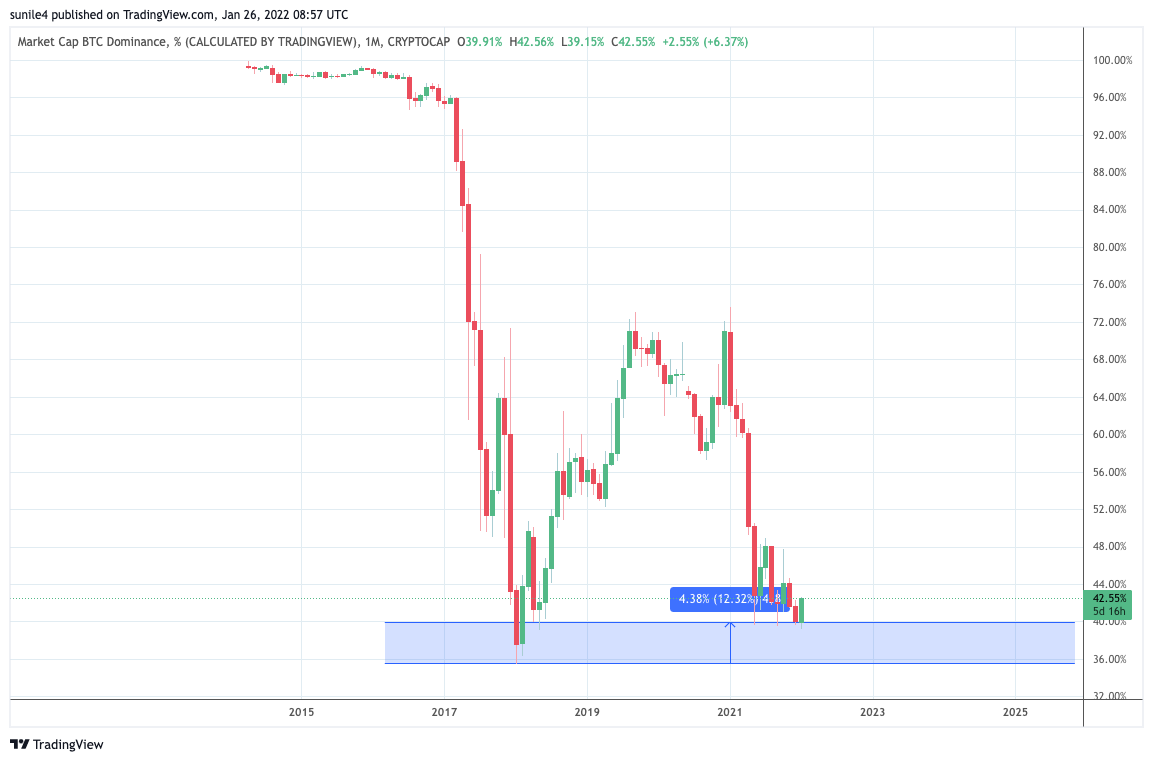
Bitcoin Dominance is another key chart worth looking, it visited the current range during 2017-18 bitcoin crash. The chart suggests we are very close to bottom. Regaining 50% dominance would be a key for a Bitcoin price of $100k.
Why Trust CoinGape
CoinGape has covered the cryptocurrency industry since 2017, aiming to provide informative insights Read more… to our readers. Our journal analysts bring years of experience in market analysis and blockchain technology to ensure factual accuracy and balanced reporting. By following our Editorial Policy, our writers verify every source, fact-check each story, rely on reputable sources, and attribute quotes and media correctly. We also follow a rigorous Review Methodology when evaluating exchanges and tools. From emerging blockchain projects and coin launches to industry events and technical developments, we cover all facets of the digital asset space with unwavering commitment to timely, relevant information.


Delivered every day.
- Insights that move markets
- 100,000 active subscribers


