ApeCoin Price Prediction: APE Price Targets $14.50 As Completes Rounding Bottom Formation


APE price consolidates after the previous session’s sell-off. Furthermore, the price still holds above the crucial $12.0 mark, which hints at the underlying bullish current at the APE price.
- APE price tests swing highs at $12.88 on Wednesday.
- On the 4-hour chart, APE forms a bullish rounded bottom pattern signaling more gains toward $14.50.
- RSI favors the bullish outlook in the coin.
APE price ready to jump
APE price for the past four-session is hovering in a range of $12.80 and $11.50 after surging 40% from the lows of $9.25. However, currently, the price is facing some upside resistance near $12.30, a critical support-turned-resistance level. The APE price must trade above the upper boundary of the mentioned trading range to maintain the upside momentum.
A strong buying pressure with good trading volumes will first test the immediate upside target at $13.35 as there is no stoppage in between.
Furthermore, bulls will flex their muscles to test the highs of March 19 at $14.50.
On the contrary, if the price fails to sustain the session’s low then it would meet the downside target placed at $10.58. A spike in sell order might trigger another round of selling toward the horizontal support level at $9.82.
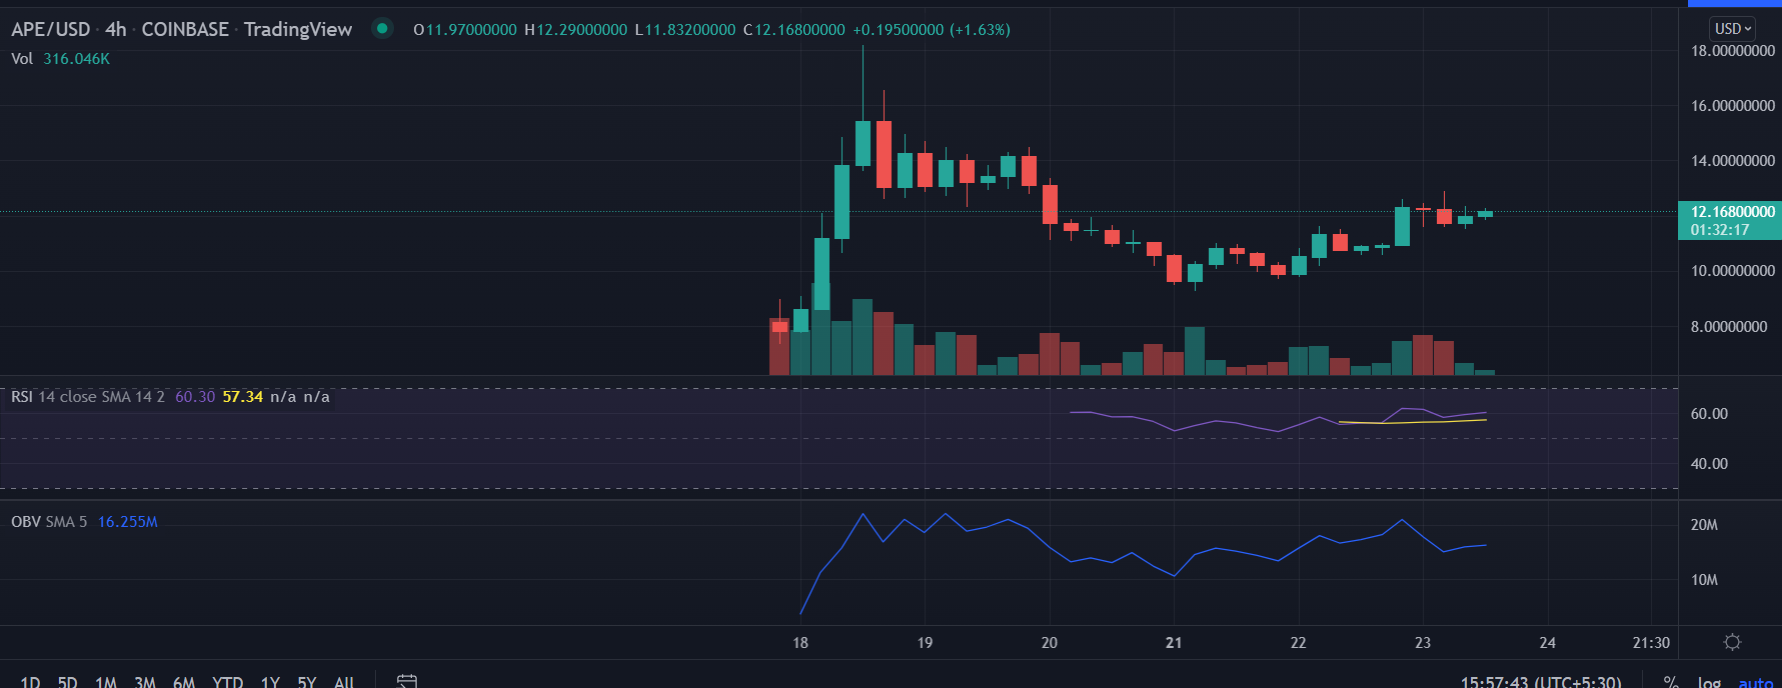
The APE price tested record high at $18.20 on March 18. Since then, the price depreciated nearly 60% to $9.25. The selling intensified as it broke the $12.30 mark. The price formed a ‘rounded bottom’ formation with the recent swing highs of $12.88. A rounded bottom is a bullish reversal pattern, which is formed as the downside pressures comes to exhaustion.
As of press time, APE/USD is trading at $12.82, up 3.32% for the day. The 24-hour trading volume is holding at $982,789,747 as per the CoinMarketCap.
Technical indicators:
RSI: The 4-hour Relative Strength Index falls below the average line with a bearish bias. The current reading is at 54, which indicates profit booking can be expected.
OBV: The On-Balance-Volume consolidates stands near the overbought zone that coincides with the levels last seen on March 18.
MACD: The Moving Average Convergence Divergence is expected to move below the midline as bearish momentum gains.
Why Trust CoinGape
CoinGape has covered the cryptocurrency industry since 2017, aiming to provide informative insights Read more…to our readers. Our journal analysts bring years of experience in market analysis and blockchain technology to ensure factual accuracy and balanced reporting. By following our Editorial Policy, our writers verify every source, fact-check each story, rely on reputable sources, and attribute quotes and media correctly. We also follow a rigorous Review Methodology when evaluating exchanges and tools. From emerging blockchain projects and coin launches to industry events and technical developments, we cover all facets of the digital asset space with unwavering commitment to timely, relevant information.