Bitcoin Price Today: BTC Remains Pressured Below $40K; Is $32k Next?


Bitcoin (BTC) price trades in a very tight range on Monday. BTC has been falling since February 16 from the highs of $44,585.69 while devaluating 16% in total value. Risk aversion and the Geopolitical truce between Russia and Ukraine kept the riskier asset including the crypto market pressurized.
- Bitcoin (BTC) price fall for the second straight day.
- BTC dipped to touch two-week lows near $37k.
- Risk-off sentiment undermines the demand for riskier assets.
In a recent development, Ukraine has reported shelling from Russia-backed separatists. On Sunday, French President Emmanuel Macron has proposed a dialogue between Russian President Vladimir Putin and his U.S. counterpart Joe Biden but that remains unheard.
As of press time, BTC/USD is trading at $37,670, down nearly 2% for the day. The world’s largest cryptocurrency by market capitalization holds a 24-hour trading volume at $23,913,778,719 with more than 40% losses.
BTC price trades near crucial level
On the daily chart, Bitcoin’s (BTC) price has been stabilized after dipping below the multi-week support of around $37k. However, the downside risk remains intact for the asset as it is currently hovering near the mentioned levels.
After testing the lows of January at $ 32,933.33 BTC/USD rallied 39% and peaked at $45,855.00 as the price sliced above the 50-day EMA (Exponential Moving Average) at $42,714.14. But bulls did not have the conviction to sustain near the upper levels.
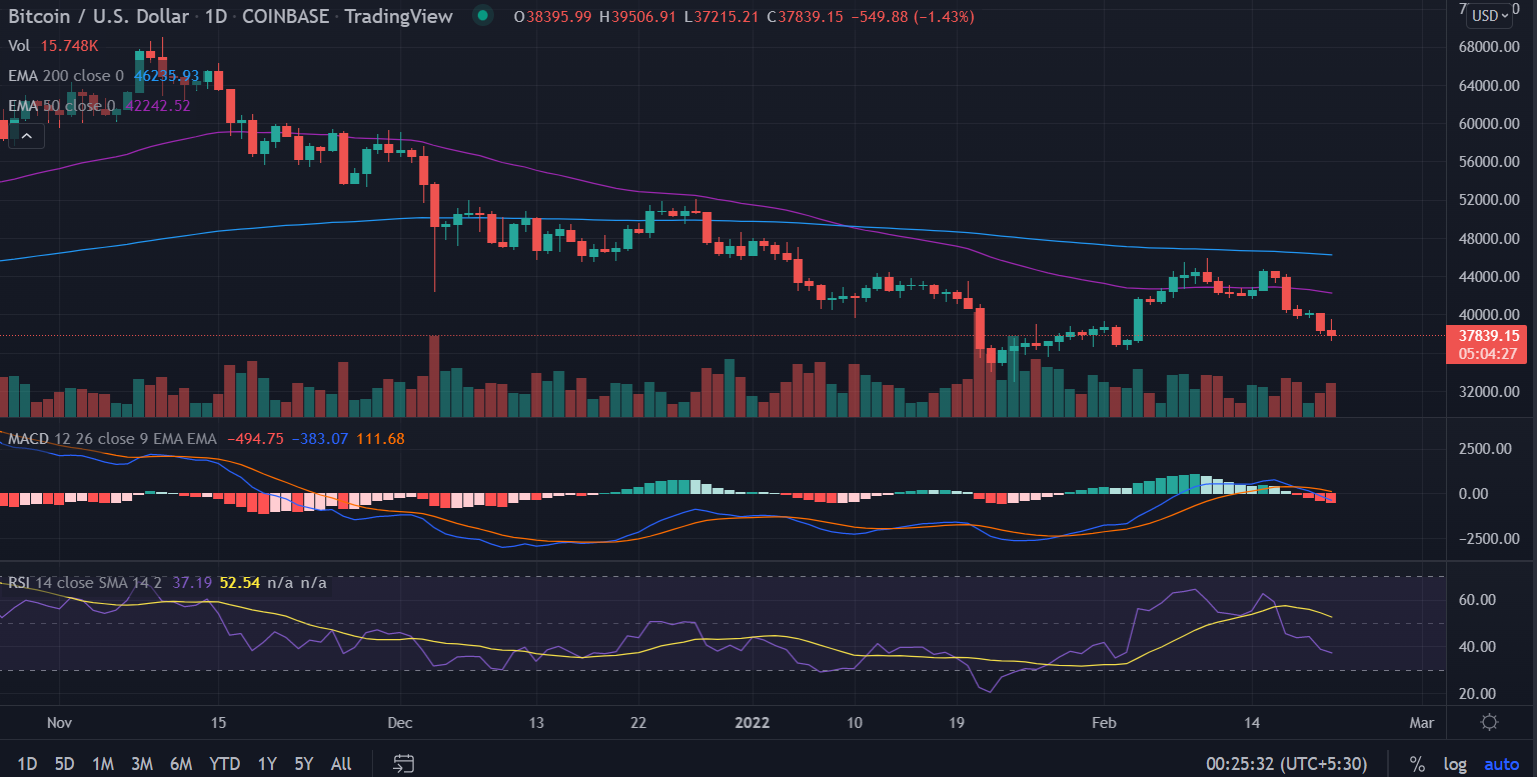
Furthermore, the critical 200-EMA acted as a strong resistance barrier for the bulls as the BTC price continues to face the stiff hurdle since December 5.
Now, a daily close below the session’s low will trigger a fresh round of selling with the immediate target at $32,000.
On the flip side, a sudden buying interest could produce a green candlestick on the daily chart. Investors meet the first upside hurdle at 50-day EMA at $42,648.50 followed by the highs of February 10 at $45,855.00.
Technical indicators:
RSI: The Daily Relative Strength Index (RSI) reads below the moving average at 36 with a bearish bias.
MACD: The Moving Average Convergence Divergence (MACD) falls below the midline with advancing downside momentum.
Why Trust CoinGape
CoinGape has covered the cryptocurrency industry since 2017, aiming to provide informative insights Read more…to our readers. Our journal analysts bring years of experience in market analysis and blockchain technology to ensure factual accuracy and balanced reporting. By following our Editorial Policy, our writers verify every source, fact-check each story, rely on reputable sources, and attribute quotes and media correctly. We also follow a rigorous Review Methodology when evaluating exchanges and tools. From emerging blockchain projects and coin launches to industry events and technical developments, we cover all facets of the digital asset space with unwavering commitment to timely, relevant information.


Will Bitcoin reach $250,000 by December 31, 2026?