Bitcoin Price Analysis: BTC Consolidates Below $24,000; Is Bounce Back Possible?


Bitcoin price analysis indicates extended consolidation for the second straight day. The BTC/USD pair opens the session lower and is looking for support near $23,500 on the hourly chart. After making a fresh swing high of $24,929.99 in the previous session BTC bulls seem exhausted.
- Bitcoin price consolidates for the second straight session on Saturday.
- A retest of the critical support of around $23,500 looks like a healthy correction.
- However, a fall below $23,300 would invalidate any bullish outlook.
Bitcoin price extends consolidation

On the daily chart, the Bitcoin price analysis shows consolidation before the next move. The price is trading in a “Rising Wedge” pattern. A rising wedge is generally a bearish signal as it indicates a possible reversal during an uptrend.
Rising wedge patterns indicate the likelihood of falling prices after a breakout through the lower trend line.
According to this pattern, If the price is able to close below the structured rising support line, then the price takes a turnaround to bearish momentum from bullish momentum.
If the bulls managed to sustain the session’s lower level then there is a higher probability of the price moving high levels. In that case, the upside target could be found near the 0.618% Fibonacci level at $26,144.0.
In the previous trading session, the price scaled up above $24,000, which remained unbroken since June 12. The price breaks below the 50% Fibonacci Retracement level as shown in the charts.
The real question is, will the big players have exited from this recent move, and now, again came with selling?
The expected fall is BTC price can move down to $22,900, which also acts as a previous swing low, as well as a 50% Fibonacci Retrecamnet of the impulse move from $17,671 to $24,900 started from June 18 – Aug. 11.
The volumes are declining, with the rising price of a BTC, which implies worrisome sentiment. When the market is rising while volume is declining the implication of missing big money from the market, more likely slowly exiting positions.
1-hour chart indicates a bounce back
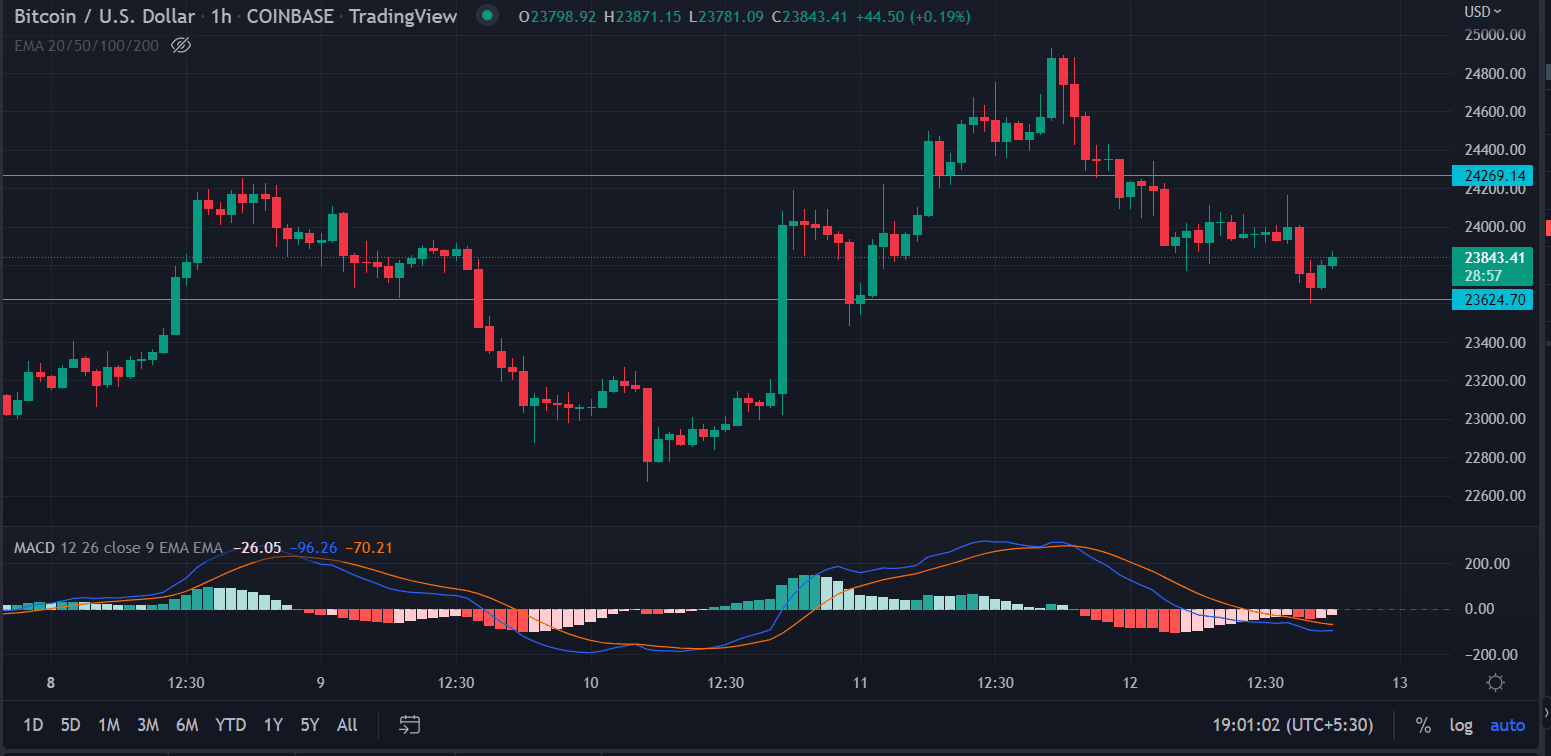
On the four-hour time frame, the price is still making higher highs and higher lows, but the new highs are just rejection candles, not bullish ones. Which is the reason, why a heavy sell-off is not happening yet.
Also read: https://coingape.com/after-coinbase-deal-blackrock-launches-bitcoin-private-trust/
The price took support near the $23,500 level, a vital support zone. The upside is capped near $24,200. Additional buying pressure could push toward $24,900.
The high target could be $26,000 for BTC bulls.
On the other hand, if the price breaks its recent swing low, we can expect a good fall in BTC.
Why Trust CoinGape
CoinGape has covered the cryptocurrency industry since 2017, aiming to provide informative insights Read more…to our readers. Our journal analysts bring years of experience in market analysis and blockchain technology to ensure factual accuracy and balanced reporting. By following our Editorial Policy, our writers verify every source, fact-check each story, rely on reputable sources, and attribute quotes and media correctly. We also follow a rigorous Review Methodology when evaluating exchanges and tools. From emerging blockchain projects and coin launches to industry events and technical developments, we cover all facets of the digital asset space with unwavering commitment to timely, relevant information.


Will Bitcoin reach $250,000 by December 31, 2026?