Bitcoin Price Outlook After Fed Holds Rates at 3.5%-3.75% Amid Yield Fears



Highlights
- Fed held rates at 3.50%-3.75% while three officials backed hikes.
- Bitcoin price hovered $64,493 with momentum indicators becoming more and more bullish.
- ETF inflows reached $32.11 million, led by BlackRock’s IBIT fund.
Bitcoin price remained trapped between $63,000 and $64,000 as traders assessed the Federal Reserve’s latest interest-rate decision. Increasing Treasury yields, oil prices, and inflation issues due to tariffs are all adding pressure on risk assets.
The wider crypto market dropped 0.68% to $2.18 trillion in 24 hours. Weak United States equities pressured risk assets and limited demand for major cryptocurrencies this week.
Ethereum price traded near $1,900, while XRP and Dogecoin recorded similarly muted price action.
Bitcoin open interest had increased by 1.52%, indicating that leveraged exposure had increased amidst unpredictable market conditions. Coinglass data showed nearly $400 million in liquidations, with bullish long positions accounting for most losses.


Fed Keeps Rates Unchanged Amid Growing Dissent
The Federal Reserve maintained its benchmark interest rate between 3.50% and 3.75% for the fifth consecutive meeting. The vote was rather anticipated, but the split in voting indicated more people were in favor of tighter monetary policy.
Officials approved the decision by a 9-3 vote, the most same-direction dissents since September 2016. Neel Kashkari and Beth Hammack, along with Lorie Logan, advocated a 25-basis-point rise. Their stand was indicative of worries on inflation, bond yields, and policy risks of remaining in place.
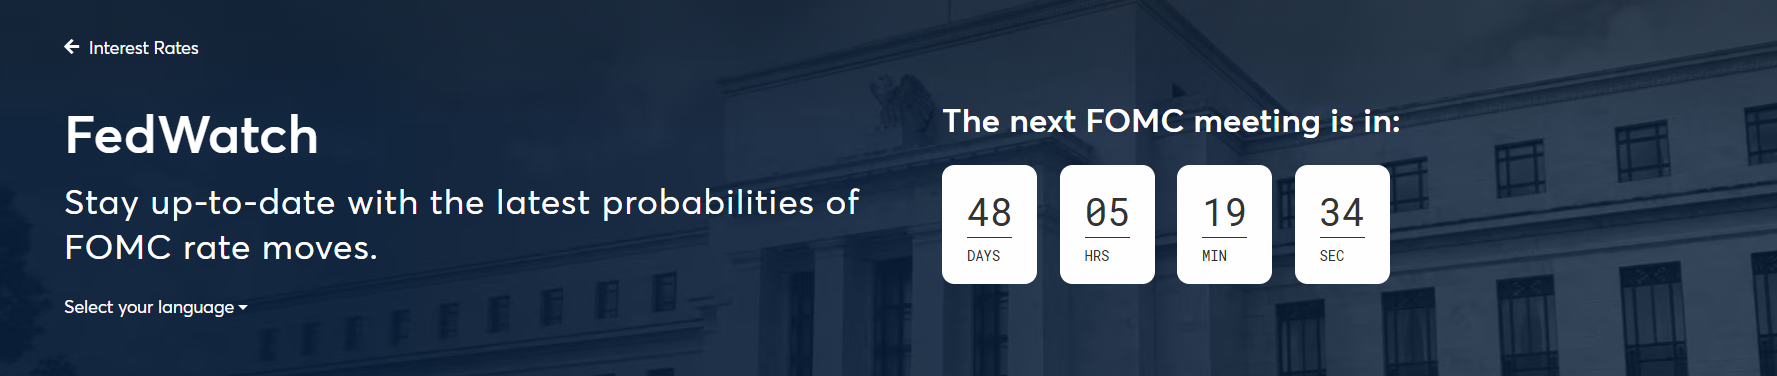
Traders now estimate a 57% chance of a rate increase at the September meeting. Increasing Treasury yields may limit the recovery of Bitcoin since rising yields tend to diminish the demand of speculative assets. The next FOMC meeting is in 48 days
Sentiment was also burdened by geopolitical tensions following the United States once again in military attacks against Iran. This move was taken after the Iranian ballistic missile attack on American forces in the Middle East.


Bitcoin ETFs Post $32.11M Inflows as BlackRock’s IBIT Leads
U.S. spot Bitcoin ETFs recorded $32.11 million in net inflows on July 29, according to SoSoValue. The IBIT of BlackRock contributed to the most gains of $89.83 million, but withdrawals by other funds decreased the total.
Spot Ethereum ETFs also recorded negative returns of net outflows amounting to $18.65 million.
Bitcoin ETFs Draw $32 Million as BlackRock Leads Inflows
U.S. spot Bitcoin ETFs recorded net inflows of USD 32.11 million on July 29, according to SoSoValue, with BlackRock’s IBIT attracting USD 89.83 million as outflows from other funds offset part of the gain. Among spot… pic.twitter.com/6xX6C8NNTk
— Wu Blockchain (@WuBlockchain) July 30, 2026
The Ethereum product with the largest inflow was still the newly launched MSSE at Morgan Stanley, which received 14.30 million dollars.
Analyst Ali Predicts Bitcoin Price Retest of $60K Before Major Breakout
Crypto analyst Ali predictis the Bitcoin price could fall toward $60,000 before attempting another major breakout
He explained that the drop could contribute to the formation of an inverse head-and-shoulder pattern on the 12-hour chart. The trend is still not complete as Bitcoin continues to trade below the neckline at around $66,500.
Don’t fear a drop to $60,000.
For Bitcoin $BTC, it could be exactly what’s needed to complete an inverse head-and-shoulders pattern. A confirmed breakout above $66,500 would then put $74,000 in play. https://t.co/b6blmQV2mS pic.twitter.com/evHdeGqZab
— Ali Charts (@alicharts) July 30, 2026
A decisive break above $66,500 would validate the set up and reinforce anticipations of additional gains. The measured target of the pattern then projected the move of the long-term BTC projection to an estimated level of $74,000.
But the inability to capture the $60,000 area might undermine the framework and delay the anticipated breakout.
BTC Price Analysis
BTC price traded at $64,493 on the four-hour chart after gaining 0.90% during the latest candle.
The Relative Strength Index rose to 53, and momentum is over the neutral 50 level.
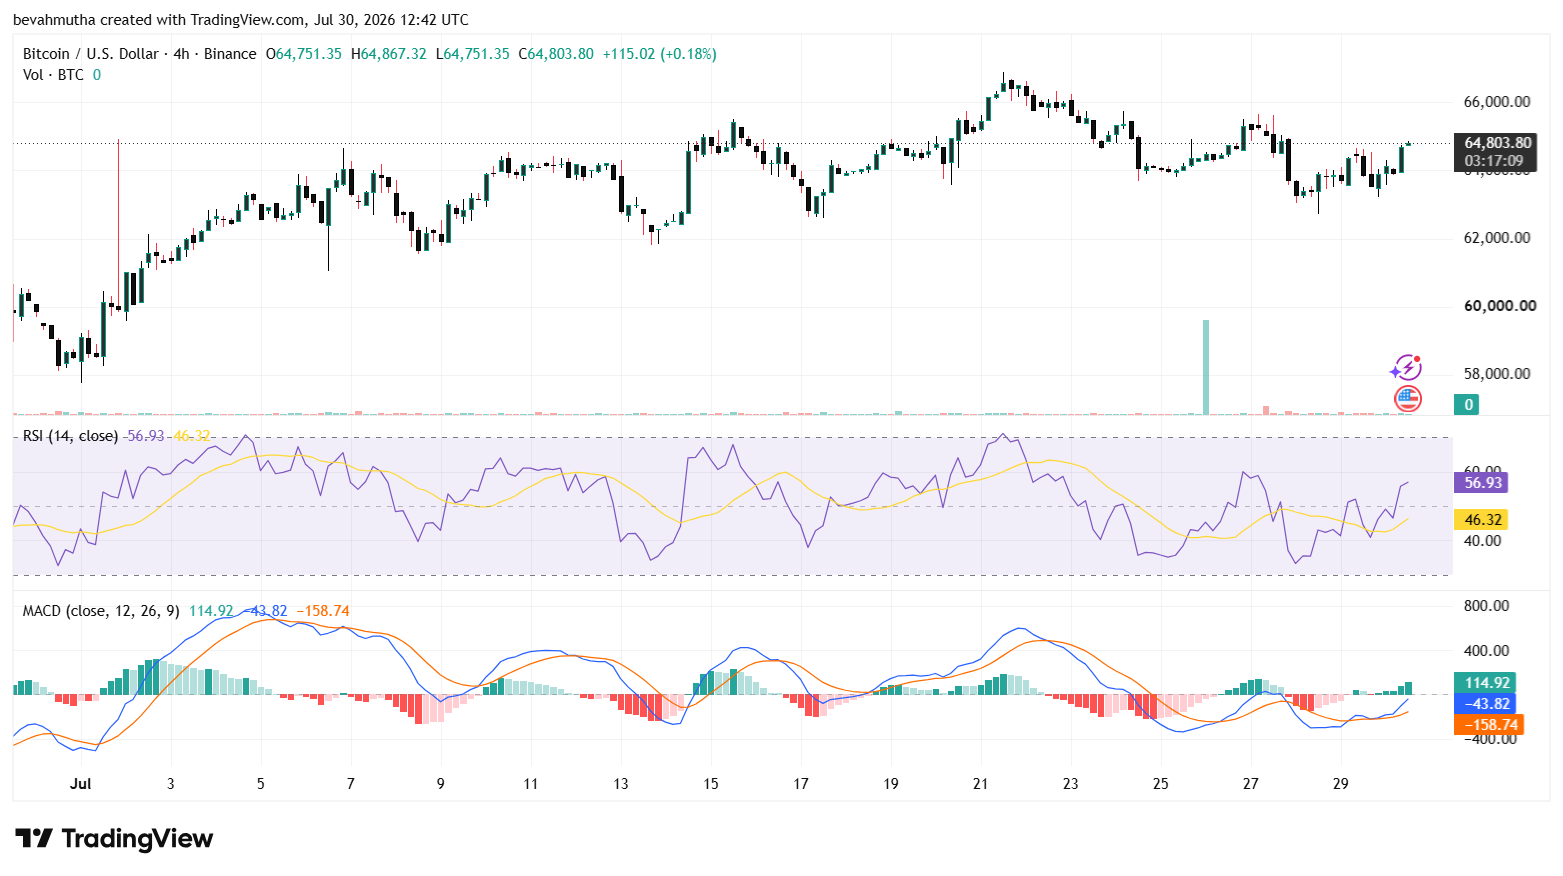
The MACD histogram became positive at 66.30 with the improvement of short-term momentum. The MACD line has also crossed over the signal line, creating a bullish crossover below the zero line.
Instant Currency Exchange at BestChange with Ease
- Compare Rates Across 1000+ Exchanges
- Access 250+ Cryptocurrencies & Pairs
- Save Time with Real-Time Price Tracking
- Trusted & Verified Exchange Listings

Frequently Asked Questions (FAQs)
1. How did Bitcoin react to the Fed’s rate decision?
2. Why did the Federal Reserve hold interest rates unchanged?
Why Trust CoinGape
CoinGape has covered the cryptocurrency industry since 2017, aiming to provide informative insights Read more…to our readers. Our journal analysts bring years of experience in market analysis and blockchain technology to ensure factual accuracy and balanced reporting. By following our Editorial Policy, our writers verify every source, fact-check each story, rely on reputable sources, and attribute quotes and media correctly. We also follow a rigorous Review Methodology when evaluating exchanges and tools. From emerging blockchain projects and coin launches to industry events and technical developments, we cover all facets of the digital asset space with unwavering commitment to timely, relevant information.

24 Hours volume
$21.19B
Market Cap
$1.69T
Max Supply
21M



Delivered every day.
- Insights that move markets
- 100,000 active subscribers

CRYPTO IMPACT AWARDS 2026