Chainlink Price Could Crash as 3 Risky Patterns Form Amid Whale Selling


Highlights
- Chainlink price has formed some common chart patterns pointing to more downside.
- It has formed an inverse cup-and-handle pattern and a death cross patterns.
- Whales have continued selling their tokens in the past few months as they expect it to keep falling.
Chainlink price has crashed in the past few months, moving from a high of $27 in August to the current $15.75. Technicals suggest that the LINK price may continue falling as whales continue dumping the token.
Chainlink Price Forms Death Cross and Inverse Cup and Handle Pattern
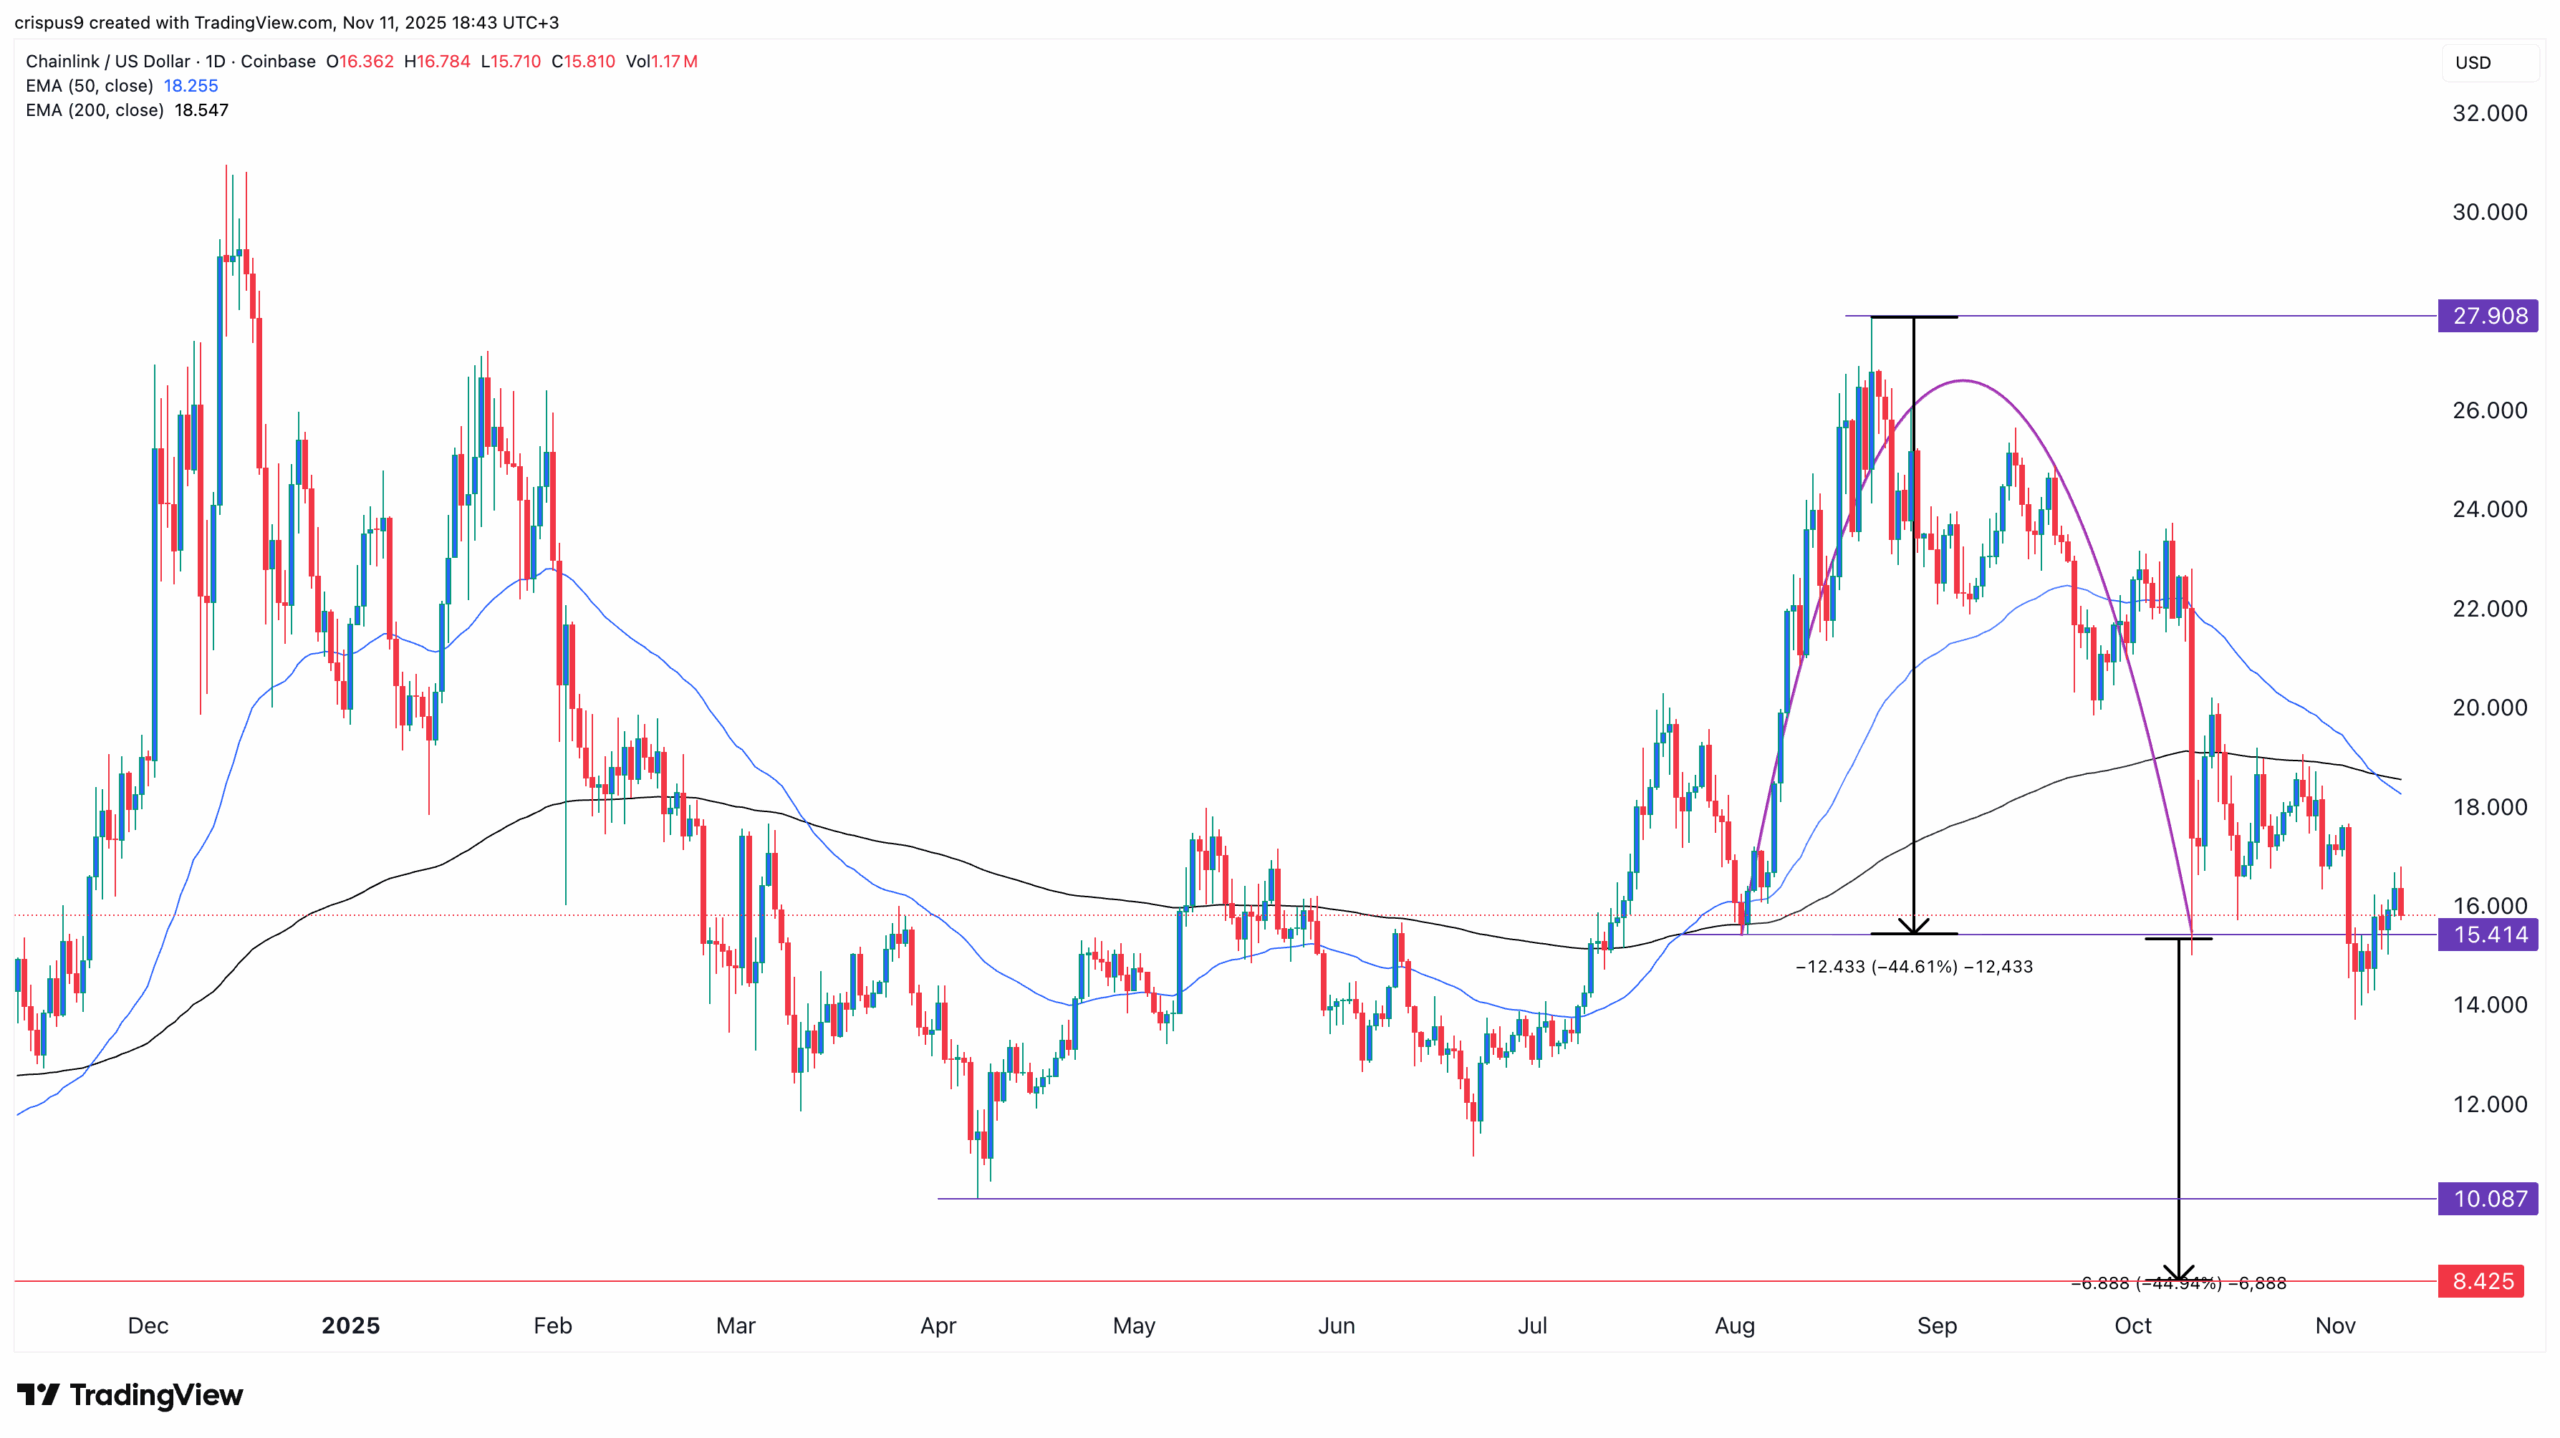
The daily timeframe chart shows that the Chainlink price has more downside in the coming weeks. It has now formed a death cross pattern, which happens when the 50-day moving average drops below the 200-day average when pointing downward. This cross happened on November 6, confirming the bearish breakout.
LINK price has also formed an inverse cup-and-handle pattern on this chart. This pattern is made up of a horizontal line at $15.41 and a rounded top. It is now in the process of forming the handle section.
The profit target in this pattern is estimated by measuring the cup’s depth. One then measures the same distance from the lower side, which, in this case, gives it a target of $8.50. This LINK price forecast will be confirmed when the coin drops below the crucial support at $10, its lowest level in April.
LINK Price Has Formed a Head and Shoulders Pattern
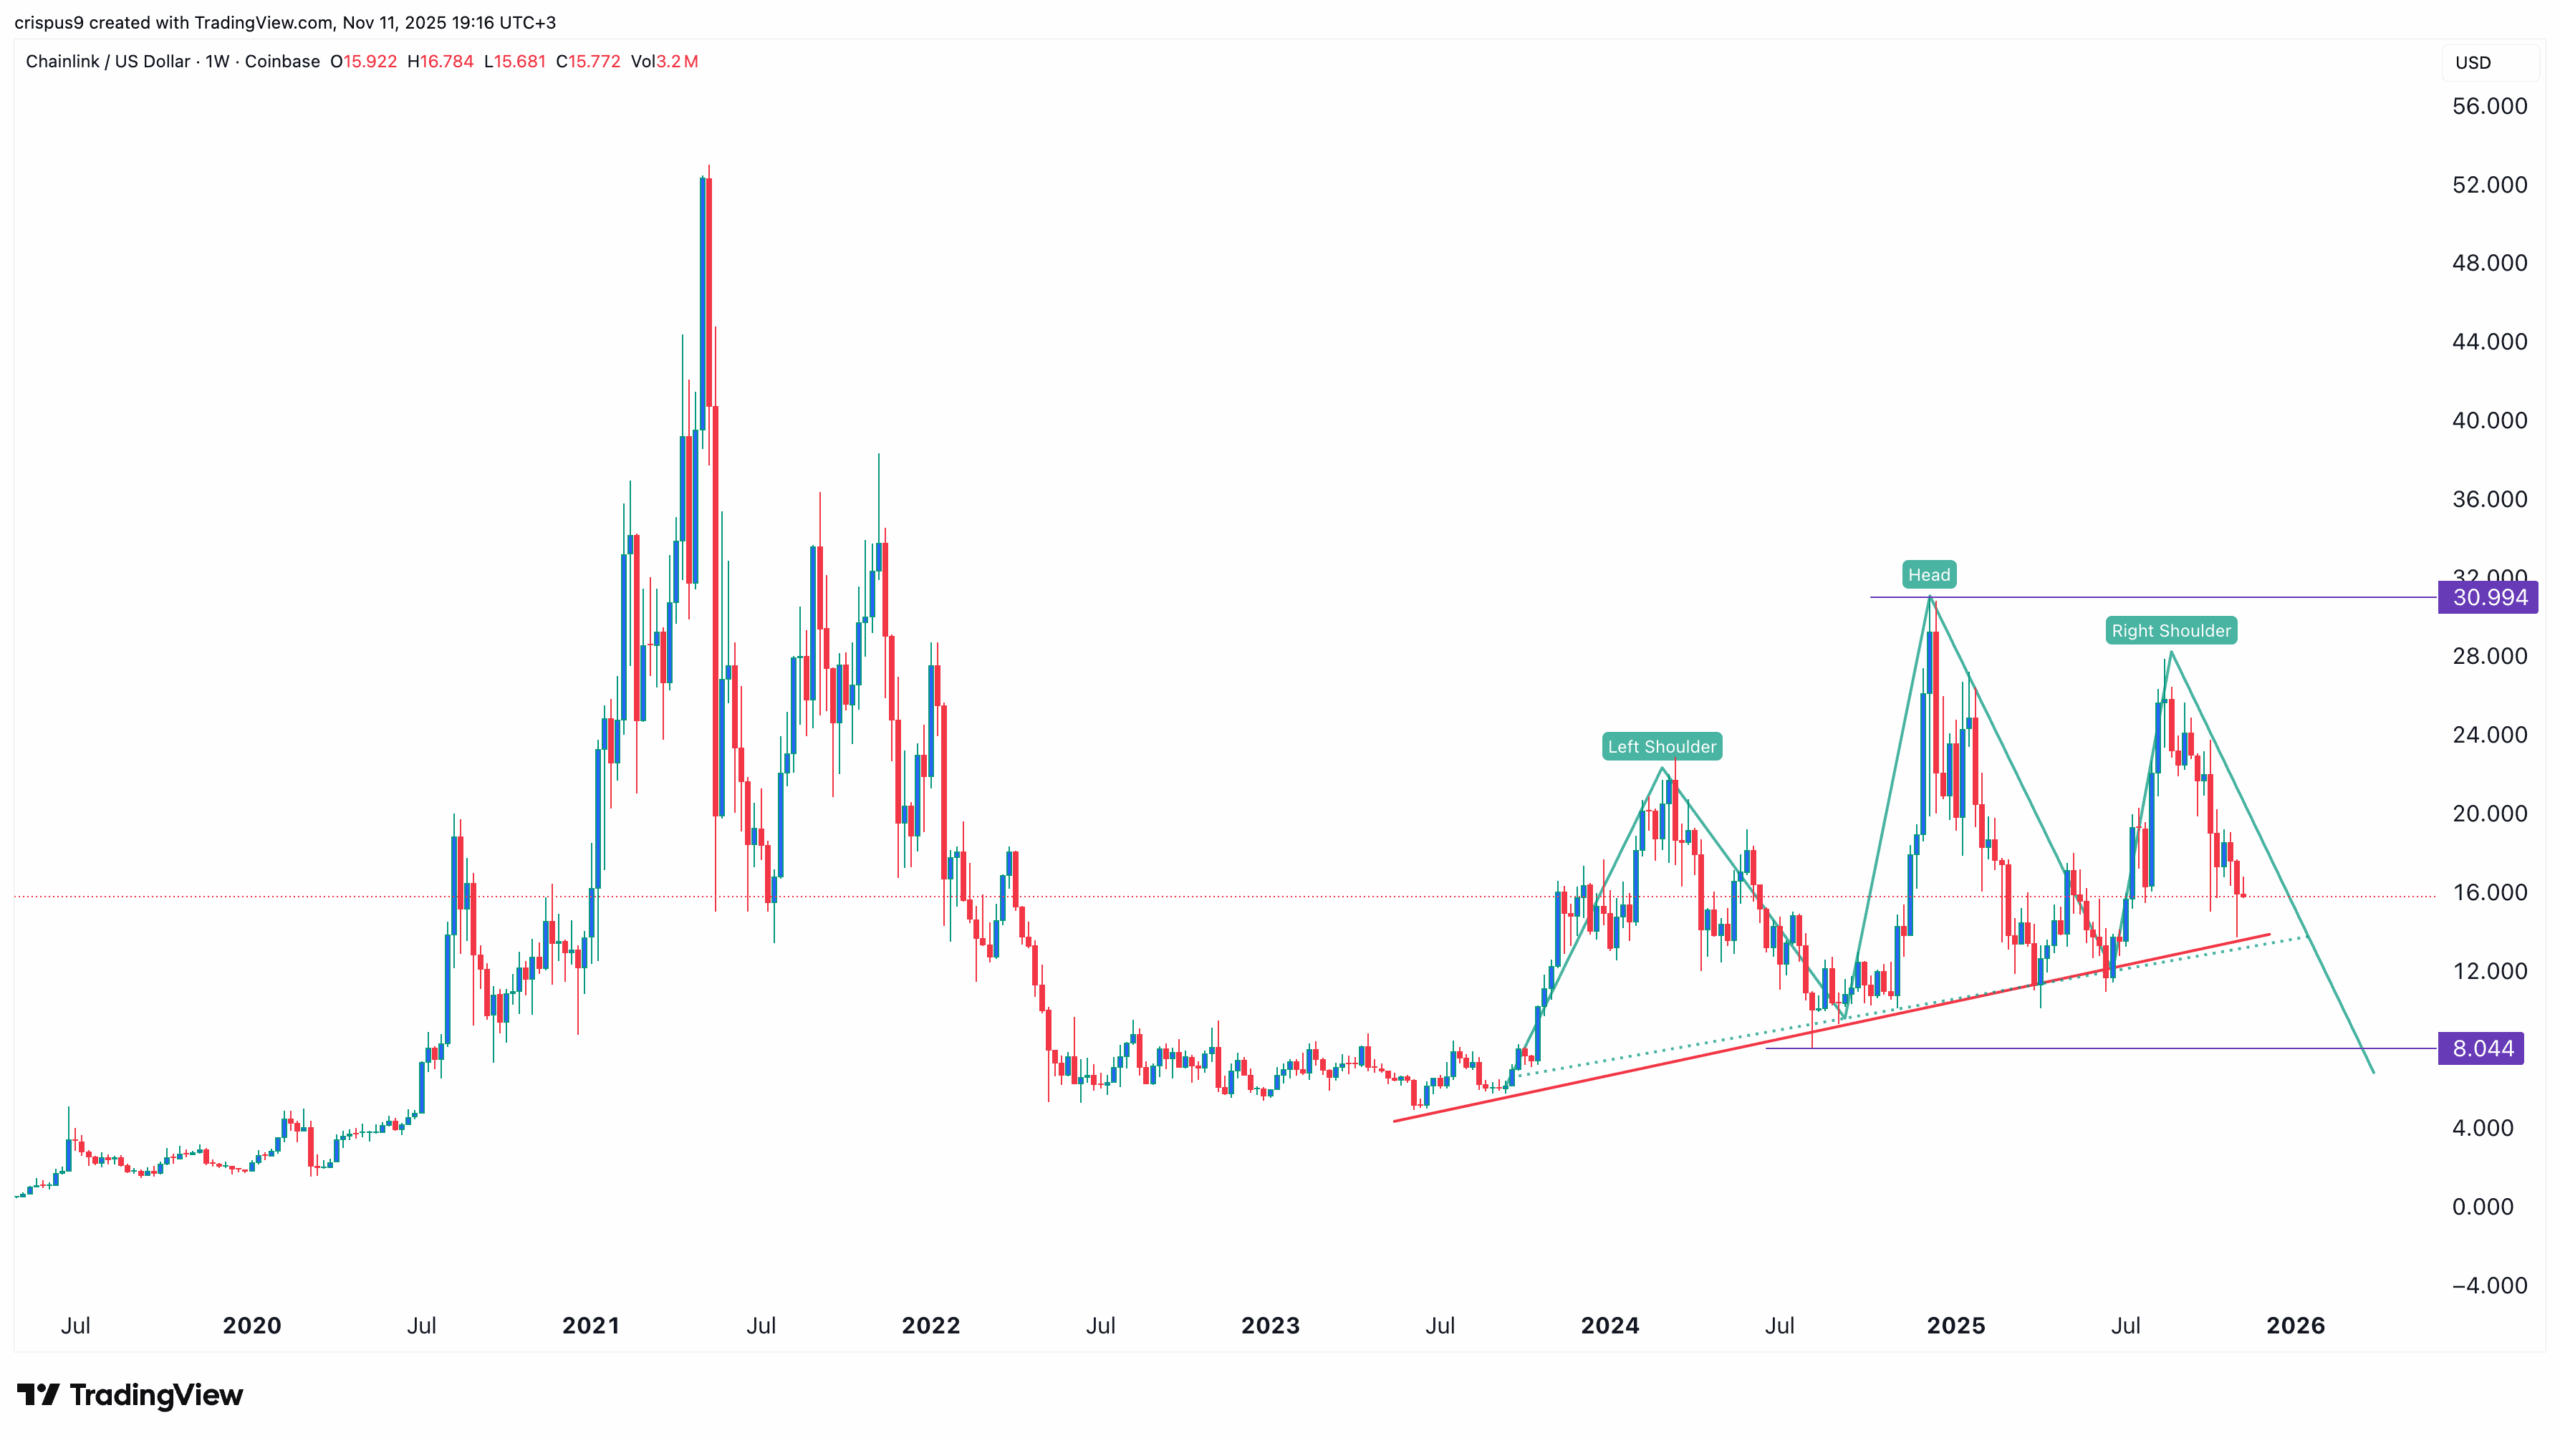
Meanwhile, the weekly chart suggests that the LINK price may have a strong bearish breakout in the near term. That’s because the token has formed a giant head-and-shoulders pattern. This pattern is made up of a head, which is at $30.1, two shoulders, and a neckline.
The coin is now hovering near the slanted neckline. Therefore, the token will likely continue falling as sellers target the next important target at $8, the lowest swing on August 5. This target largely coincides with the one on the daily chart.
Whale Investors Have Dumped LINK Tokens
These chart patterns likely explain why whale investors have continued dumping their tokens. Data compiled by Nansen shows that whales have sold tokens to the current 2.34 million. They held over 3.14 million tokens in October, meaning that they have dumped 800k tokens worth $12 million.
The whale selling is notable as it happened at a time when Chainlink’s fundamentals are improving. For example, the developers recently held the SmartCon Conference when major deals were announced. Some of these deals were with companies like SBI Markets, Apex Global, Lido, and Aptos.
It is also happening at a time when Chainlink supply is falling. Nansen data shows that there are 221 million tokens in exchanges, down from 287 million last month. Falling exchange supply is a sign that investors are moving their tokens to self-custody.
Frequently Asked Questions (FAQs)
1. What is the most likely Chainlink price forecast?
2. What are the other bearish LINK chart signals?
3. How low can the Chainlink token drop?
Why Trust CoinGape
CoinGape has covered the cryptocurrency industry since 2017, aiming to provide informative insights Read more…to our readers. Our journal analysts bring years of experience in market analysis and blockchain technology to ensure factual accuracy and balanced reporting. By following our Editorial Policy, our writers verify every source, fact-check each story, rely on reputable sources, and attribute quotes and media correctly. We also follow a rigorous Review Methodology when evaluating exchanges and tools. From emerging blockchain projects and coin launches to industry events and technical developments, we cover all facets of the digital asset space with unwavering commitment to timely, relevant information.