Ethereum Price Prediction: Remains Sideways Near $2,600 With Good Volumes; Is Sign For A Short-Term Upside?


Ethereum price trades with caution and makes consolidative moves. ETH opened lower but managed to recover and tested the session’s highs at $2,661.38 with above an average volumes. A sustained buying pressure could result in a short-term upside in the altcoin.
- Ethereum price trades in a very tight range on Tuesday.
- Expect more gains if the price gives a decisive close above $2,640.
- ETH faces upside rejection near 50-day EMA at $2,820.
At the time of writing, ETH/USD is trading at $2,614 up 0.99% for the day. The second-largest cryptocurrency by market cap holds the 24-hour trading volume at $12,100,941,234 with gains of 8%.
Ethereum price set to rise
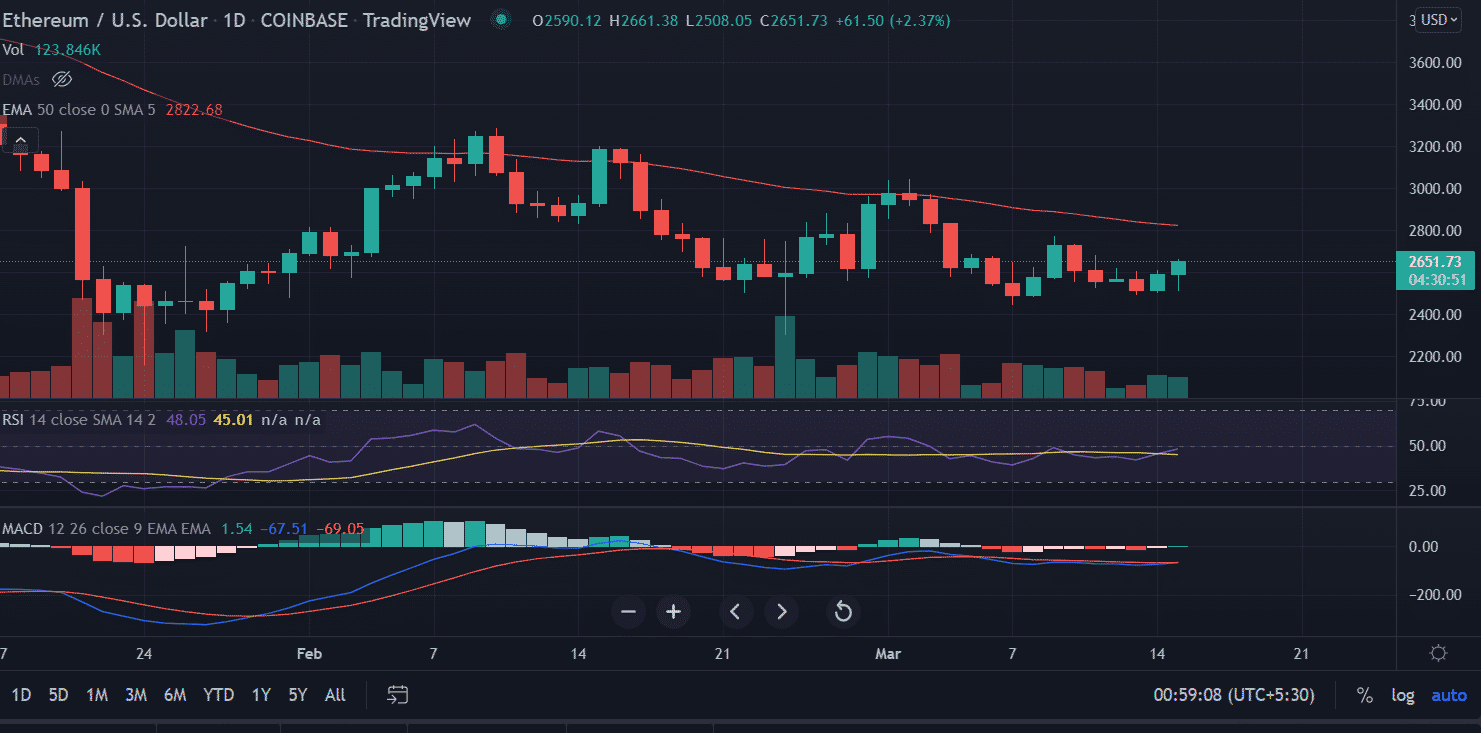
On the daily chart, Ethereum price formed a ‘ Hammer’ pattern, which is a bullish reversal formation. The pattern forms when the market is oversold and looks for a bounce from the crucial support level. In addition to that volumes also supported the technical set-up.
Now, the price decisively broke the 1-hour chart upside resistance. This signifies the underlying strength in the current price action.
For bulls, the first upside target is placed at 50-day Exponential Moving Average (EMA) at $2,852.74. Ethereum price will be encouraged to test the psychological $3,000 level next.
On the contrary, a change in the bullish sentiment will spur another downside phase in the asset. Further moving downside the immediate support is found at $2,500 followed by the lows of February 22 at $2,300.
Technical indicators:
RSI: The daily Relative Strength Index pierced above the average line with a bullish bias. An uptick in the indicator could be a positive sign for the price.
MACD: The Moving Average Convergence Divergence still hovered below the midline with a neutral outlook.
Why Trust CoinGape
CoinGape has covered the cryptocurrency industry since 2017, aiming to provide informative insights Read more…to our readers. Our journal analysts bring years of experience in market analysis and blockchain technology to ensure factual accuracy and balanced reporting. By following our Editorial Policy, our writers verify every source, fact-check each story, rely on reputable sources, and attribute quotes and media correctly. We also follow a rigorous Review Methodology when evaluating exchanges and tools. From emerging blockchain projects and coin launches to industry events and technical developments, we cover all facets of the digital asset space with unwavering commitment to timely, relevant information.