


SAND Price Analysis: Sandbox Buyers Struggles To Surpass $4 Resistance


The SAND buyers made an impressive recovery last week which rallied the coin price to $4 resistance. However, the bears defending this mark exert strong selling pressure on the traders. The coin price is likely to retest the currently lower low support of $3 with a possibility to continue the downtrend.
Key technical element to ponder
- The SAND Price shows a daily-evening star candle pattern at $4 resistance
- The intraday trading volume in the Sandbox token is $652 Million, indicating a 29.63% loss.
Sandbox Bears Regain Momentum Tease A 20% Free Gall
 Source- Tradingview
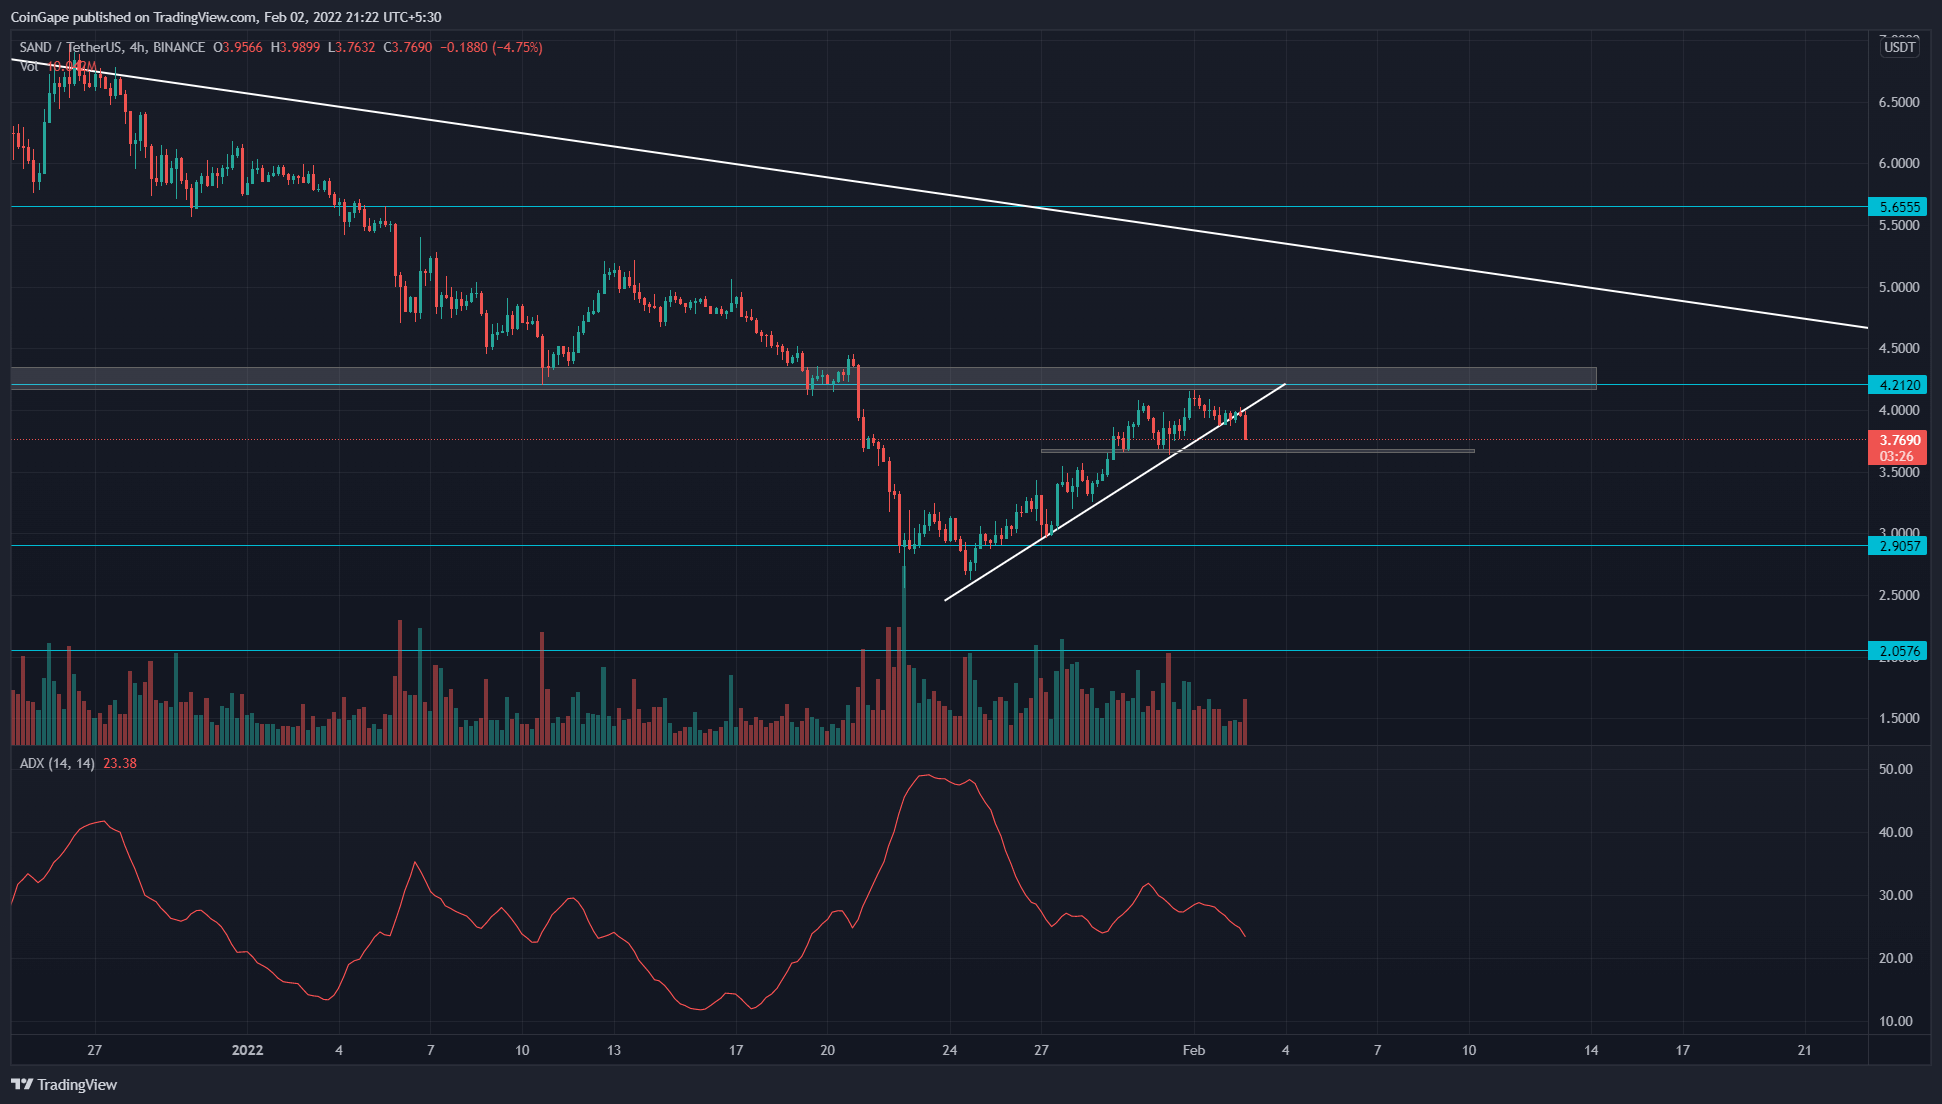
The SAND/USD technical chart showed an ascending trendline that supported the bulls during the recovery rally. However, the price action gives a fallout from this support trendline, provides an early signal for downtrend continuation.
The sellers would soon retest a minor support level of $3.6, whose breakdown will give an extra edge to short sellers.
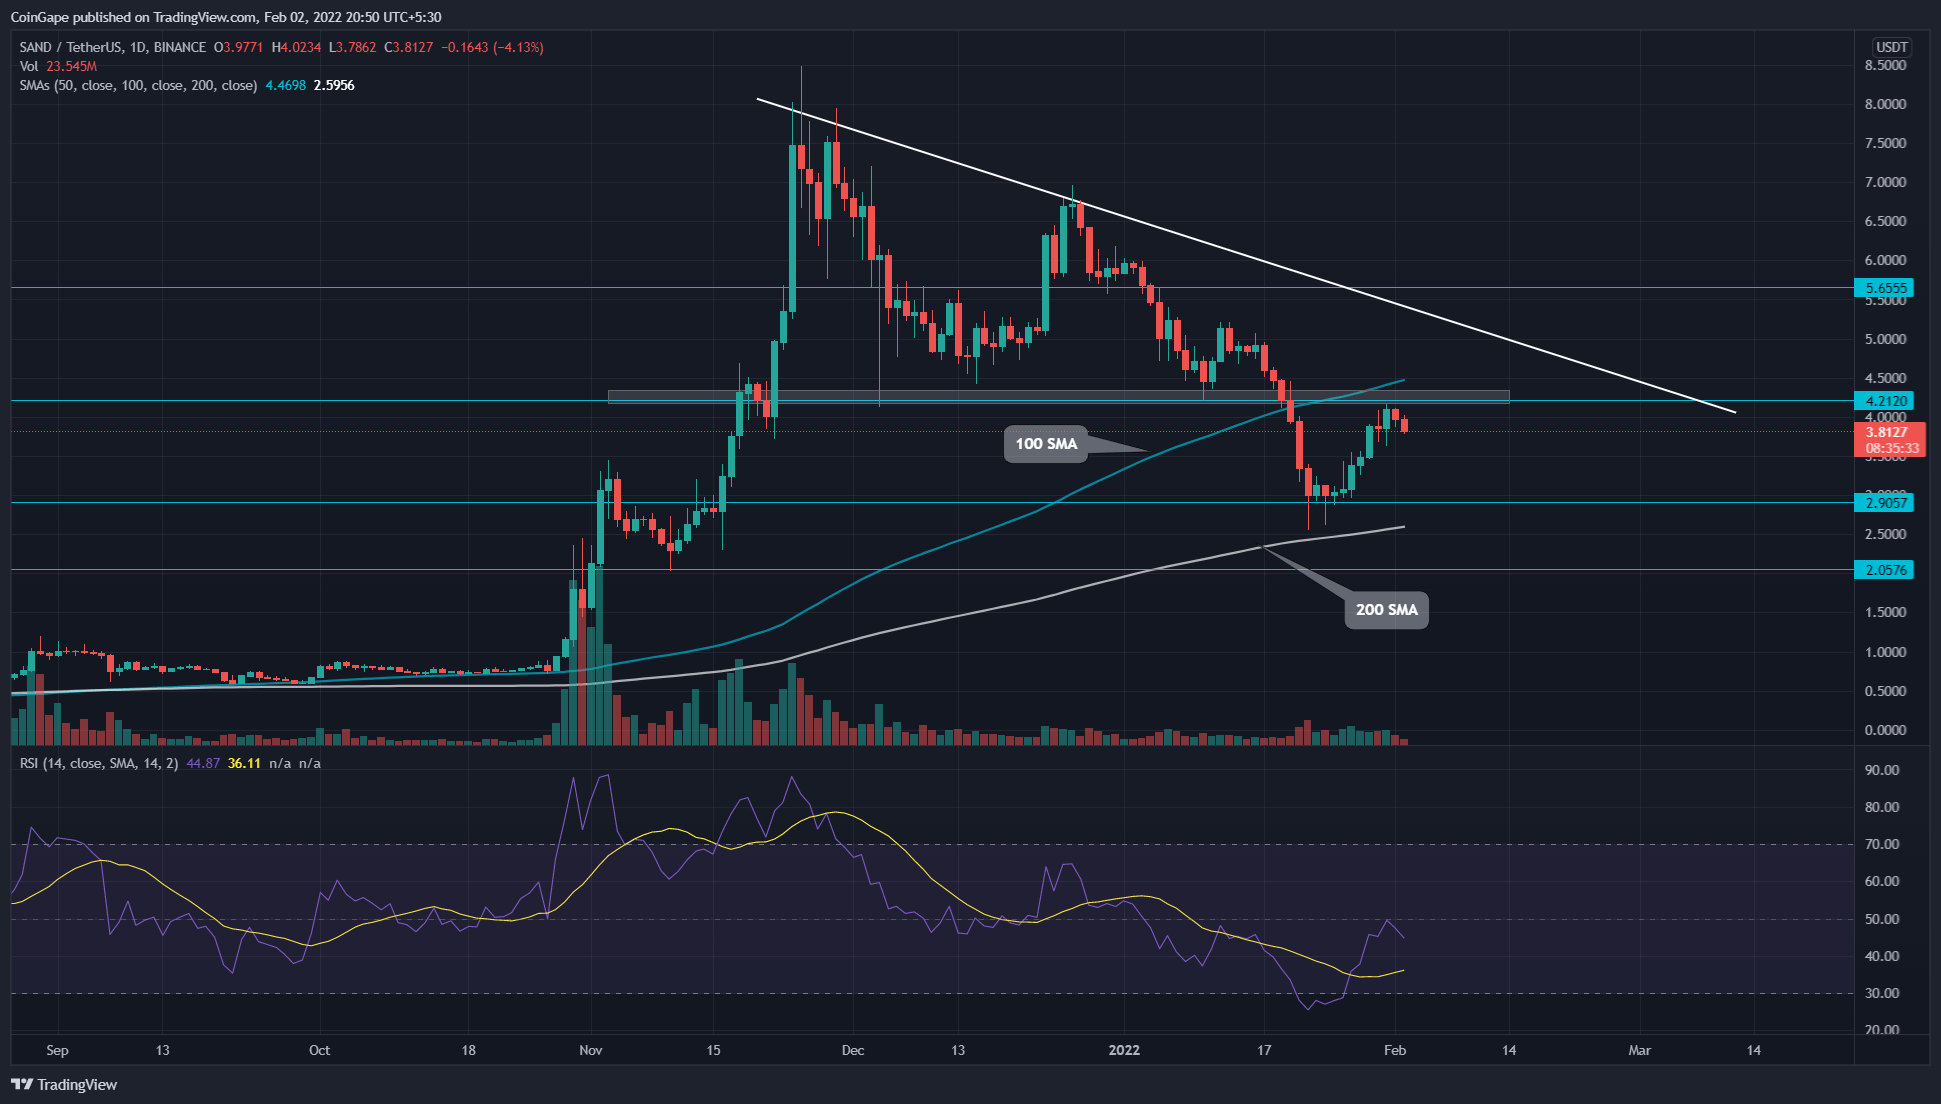
However, The coin price is trading above the 200 SMA in the daily chart, indicating the long-term trend is still bullish. However, the buyers could struggle to overcome other SMA lines(20, 50, 100) if they impose sufficient selling pressure.
 Source- Tradingview
In our previous coverage of the Sandbox token, Coingape foretold about the recovery rally to $4, when the SAND price gave a bullish breakout from an inverted head and shoulder pattern. The V-shaped price recovery gained 43% in a week, which currently challenge the overhead resistance.
If buyers could give a breakout and close above the $4 mark, the bulls have a strong chance to reverse the trend. Conversely, the formation of evening star patterns at this resistance indicates the traders are selling the rallies.
Moreover, the Relative strength index(44) presented a strong recovery during the recent price jump. However, the RSI slope failed to cross above the neutral line(50$), suggesting the bearish sentiment is intact.
- Resistance level- $4-4.2 and $5.6
- Support levels- $3.6, $3
Why Trust CoinGape
CoinGape has covered the cryptocurrency industry since 2017, aiming to provide informative insights Read more…to our readers. Our journal analysts bring years of experience in market analysis and blockchain technology to ensure factual accuracy and balanced reporting. By following our Editorial Policy, our writers verify every source, fact-check each story, rely on reputable sources, and attribute quotes and media correctly. We also follow a rigorous Review Methodology when evaluating exchanges and tools. From emerging blockchain projects and coin launches to industry events and technical developments, we cover all facets of the digital asset space with unwavering commitment to timely, relevant information.


